 ar
ar bg
bg hr
hr cs
cs da
da nl
nl fi
fi fr
fr de
de el
el hi
hi it
it ko
ko no
no pl
pl pt
pt ro
ro ru
ru es
es sv
sv tl
tl iw
iw id
id lv
lv lt
lt sr
sr sk
sk sl
sl uk
uk vi
vi et
et hu
hu th
th tr
tr fa
fa ms
ms hy
hy ka
ka ur
ur bn
bn mn
mn ta
ta kk
kk uz
uz ku
ku
Integrated Monitoring Station
A handover-ready Kingmach Integrated Monitoring Station record should explain how environmental conditions were measured and why each point exists. It should include point location, measured condition, installation photo, cable route, power source, data channel, unit, first stable reading, maintenance access, and linked structural records. This matters because environmental stations often remain useful after the construction team leaves. A later owner may need to understand whether a slope moved after rainfall, whether a bridge vibrated during wind, or whether a cabinet failed after humidity rose. Without a clear handover record, those questions become guesswork. With one, the environmental record becomes part of long-term asset management, supporting maintenance budgets, inspection planning, and abnormal-event review.
For field teams, this point is most useful when the record shows the condition before the structural response, during the response, and after the site returns to routine operation. The note should include weather timing, inspection access, nearby construction, and whether the linked structural points changed in the same period.
A good review habit is to compare the condition channel with the nearest asset behavior instead of reading it as a standalone weather value. That keeps the record tied to slope movement, bridge response, tunnel equipment, dam seepage, drainage behavior, or cabinet reliability.
The installation file should explain why the location represents the monitored area. If the point is sheltered, shaded, exposed, buried, elevated, or placed inside an enclosure, that fact changes how later readings should be understood by maintenance staff.
Application of Integrated Monitoring Station
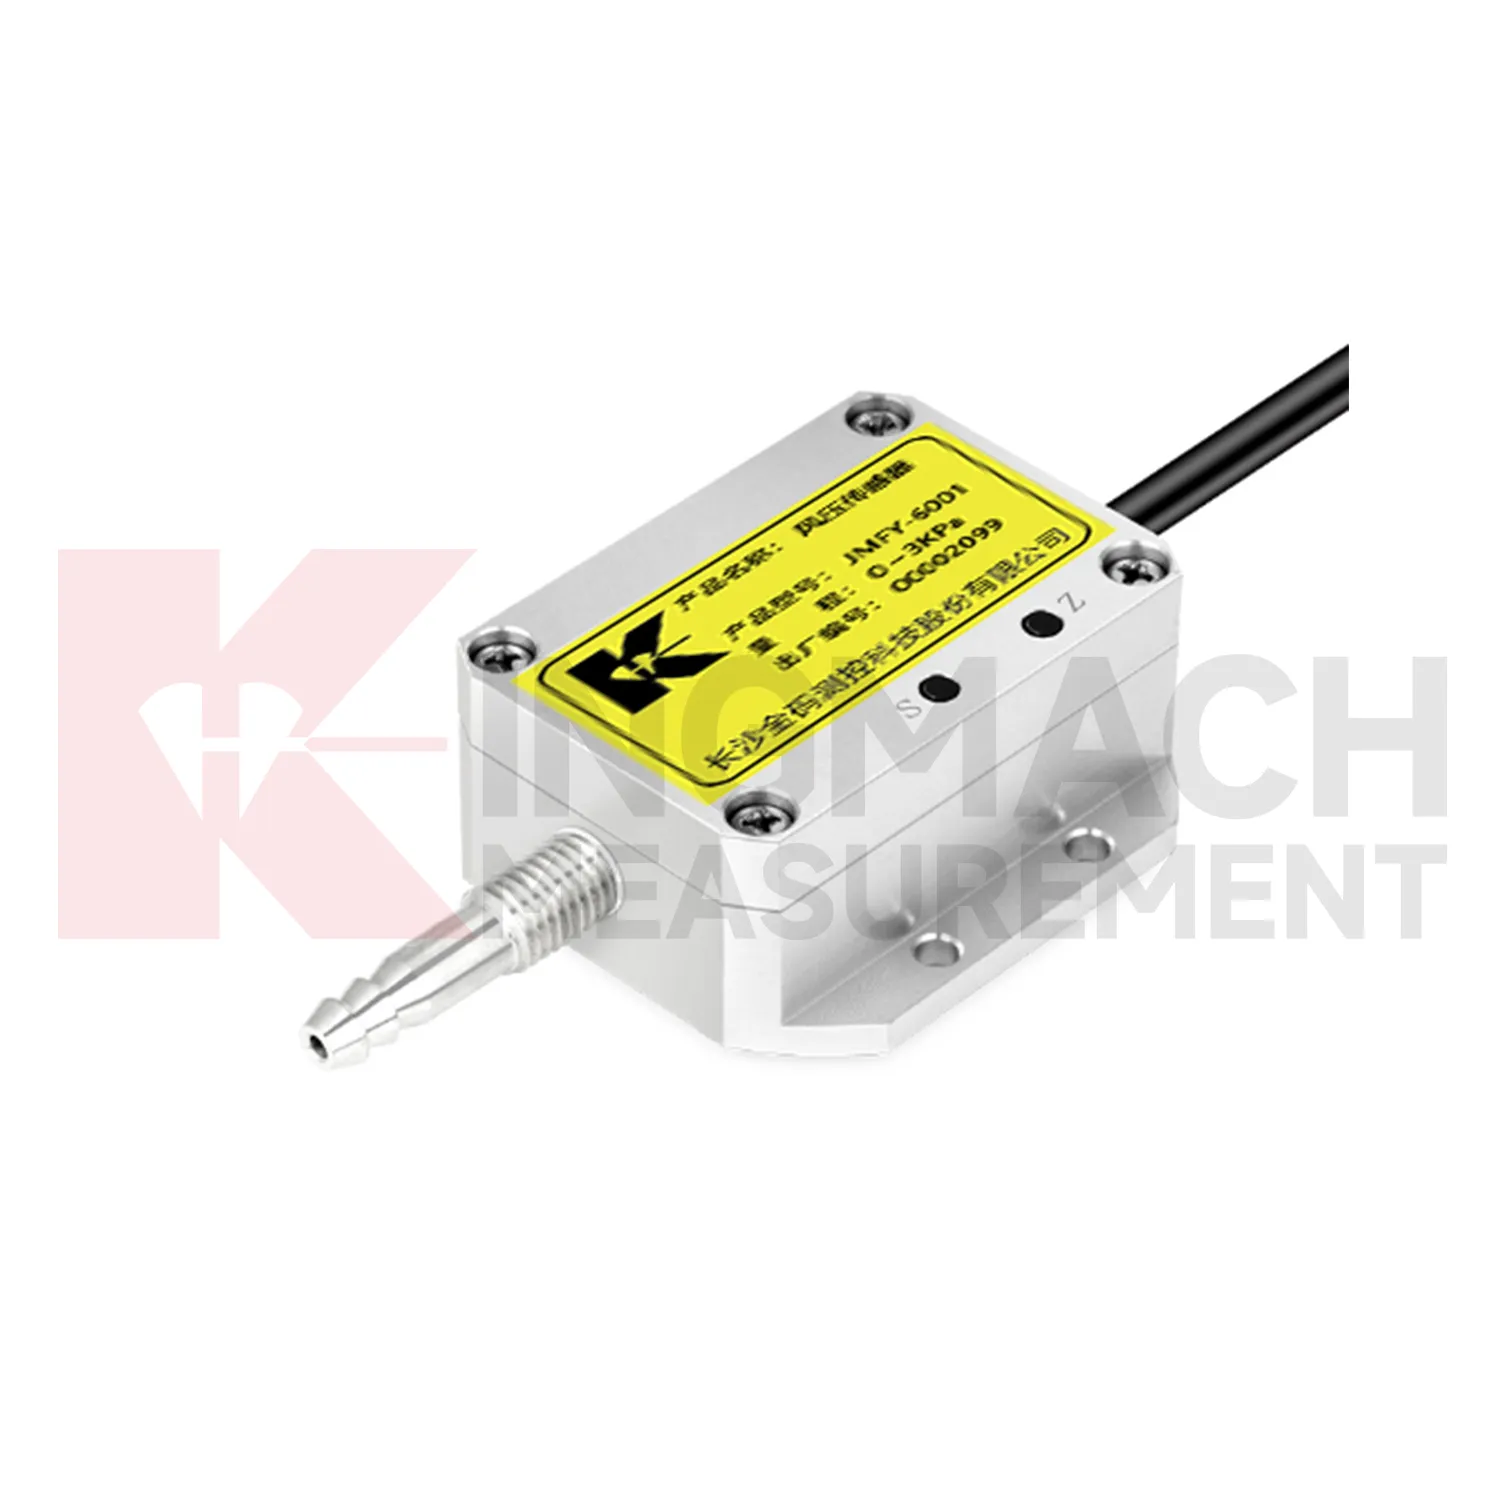
Urban environmental stations use Kingmach Integrated Monitoring Station to support infrastructure management across bridges, tunnels, public buildings, drainage areas, transport corridors, and exposed equipment sites. A station may record rain, wind, air temperature, humidity, pressure, or soil wetness depending on the risk being managed. The most important design rule is representativeness. A rain point blocked by a roof edge, a wind point sheltered by a wall, or a humidity point hidden in an unrelated cabinet can mislead users. Public infrastructure data may be reviewed by many teams, so units, point names, installation photos, and maintenance notes must be clear. A well-run station helps connect environmental change to inspections, drainage response, traffic planning, and structural monitoring.
Long-term value comes from consistency. A channel that keeps the same location, unit, maintenance history, and linked asset record can support seasonal comparison, post-storm review, and handover between construction and operation teams.
Maintenance teams should record cleaning, access difficulty, enclosure condition, cable repair, vegetation growth, nearby equipment changes, and the first normal reading after work. Those notes protect the meaning of the curve when old data is reviewed months later.
The environmental point should be part of a named monitoring question. It may explain wetting, drying, wind exposure, thermal movement, cabinet stress, or pressure variation, but that purpose needs to be visible in drawings and reports.
The future of Integrated Monitoring Station
Water-driven geotechnical review will shape future Kingmach Integrated Monitoring Station. Slopes, embankments, dams, and foundation pits often respond to rain and wetting in delayed ways. Future reports can compare rainfall timing, wetting depth, deformation rate, pore pressure, seepage, and inspection observations. This will help engineers see whether the ground only reacted briefly or remained active after the weather event. It will also support more targeted site visits because the team can identify which area had both environmental change and structural response. Environmental data will become part of geotechnical reasoning rather than a weather appendix.
If the reading seems unusual, the team should check the physical condition of the station before drawing conclusions about the asset. Blockage, poor exposure, loose wiring, water entry, and changed surroundings can all create misleading patterns.
A practical report links the condition value with time, place, and action. It should help a reviewer decide whether to keep observing, inspect the field point, compare nearby instruments, or record the event as normal site behavior.
Care & Maintenance of Integrated Monitoring Station
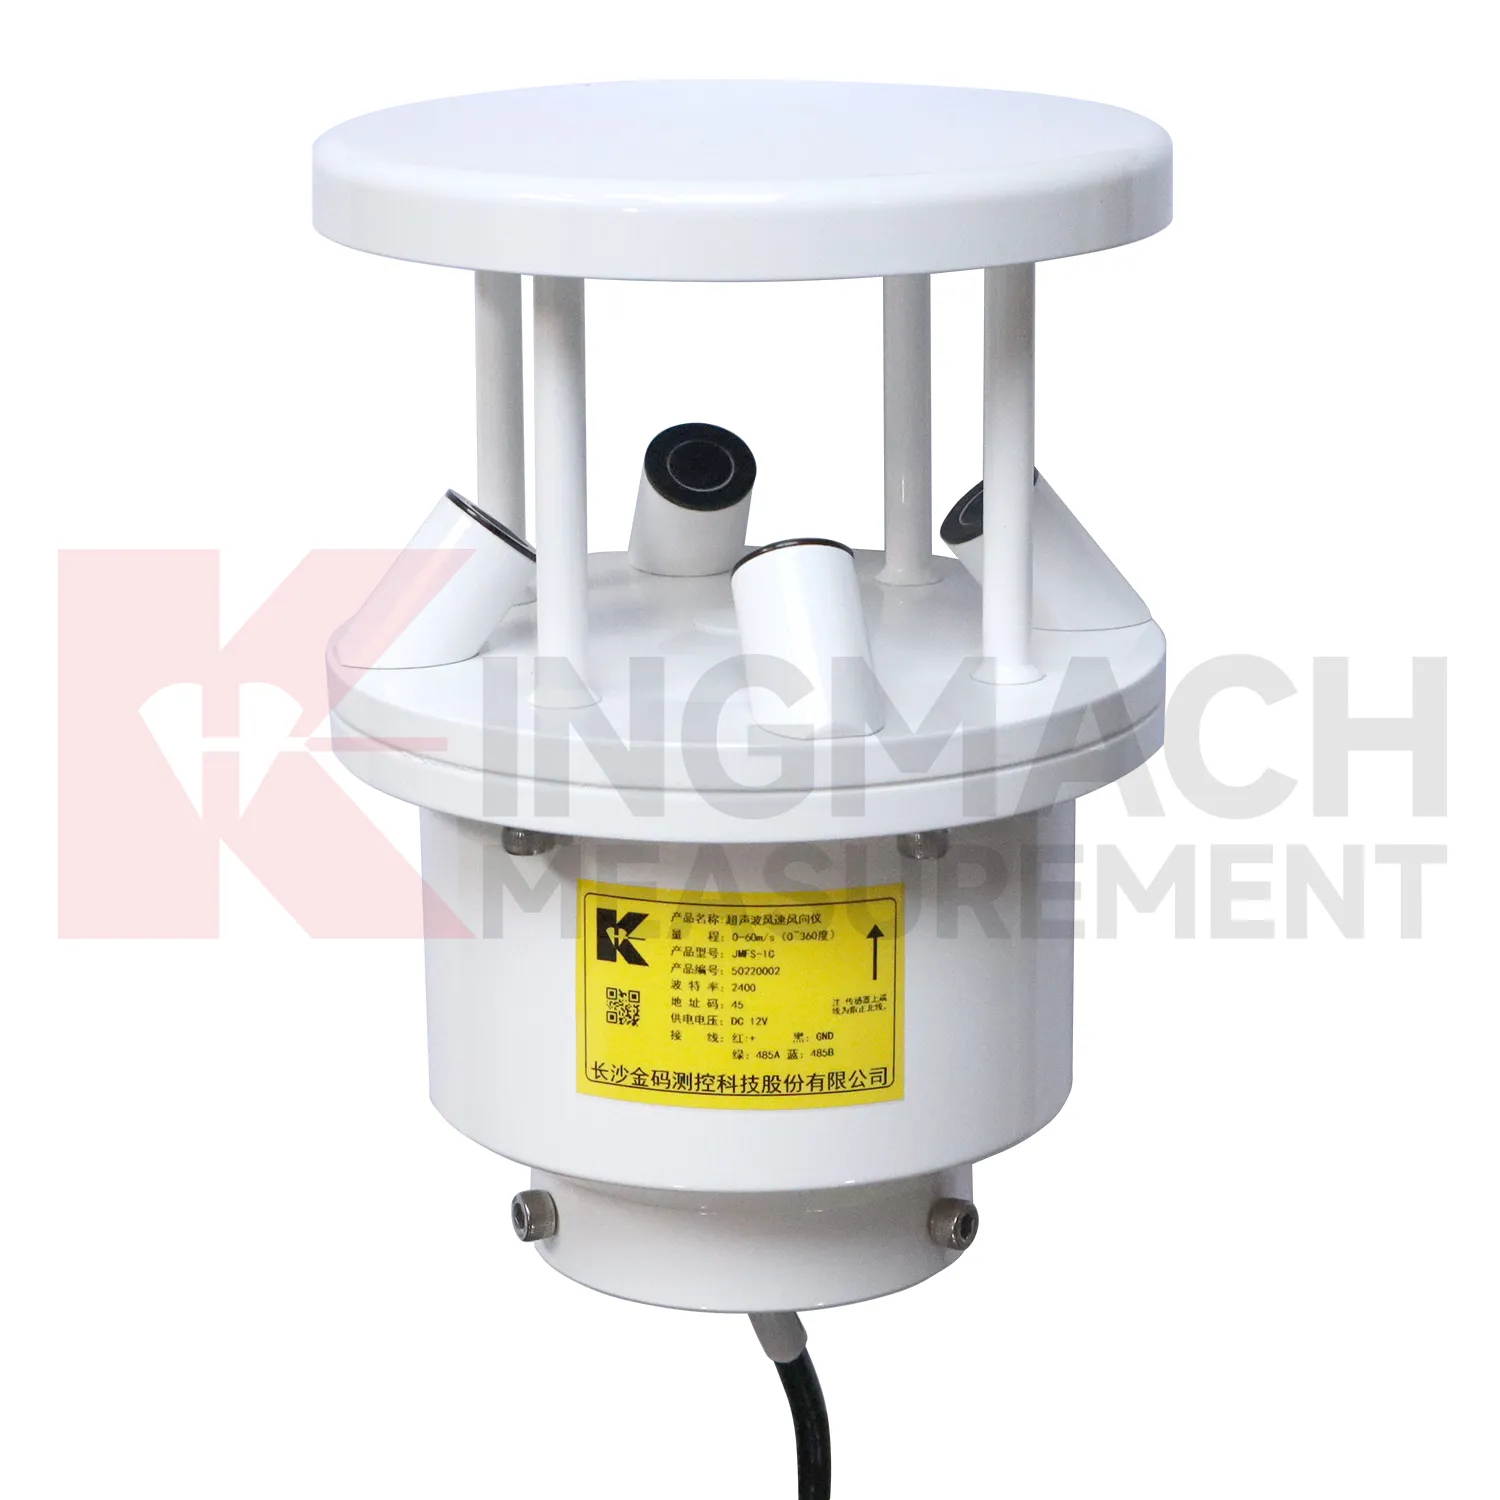
Wind-station maintenance for Kingmach Integrated Monitoring Station should preserve exposure and mounting stability. Check for new obstructions, loose poles, tilted brackets, damaged connectors, lightning effects, corrosion, ice, salt, dust, and cable strain. The wind point should represent the monitored bridge, tower, airport area, marine site, tunnel portal, or construction zone. If a nearby structure, scaffold, crane, or temporary cover changes airflow, the record may no longer explain the asset. Maintenance notes should state what was inspected, what was cleaned, and whether the first readings after work looked normal. Reliable wind data depends on both instrument condition and a clear flow path.
A good review habit is to compare the condition channel with the nearest asset behavior instead of reading it as a standalone weather value. That keeps the record tied to slope movement, bridge response, tunnel equipment, dam seepage, drainage behavior, or cabinet reliability.
The installation file should explain why the location represents the monitored area. If the point is sheltered, shaded, exposed, buried, elevated, or placed inside an enclosure, that fact changes how later readings should be understood by maintenance staff.
Kingmach Integrated Monitoring Station
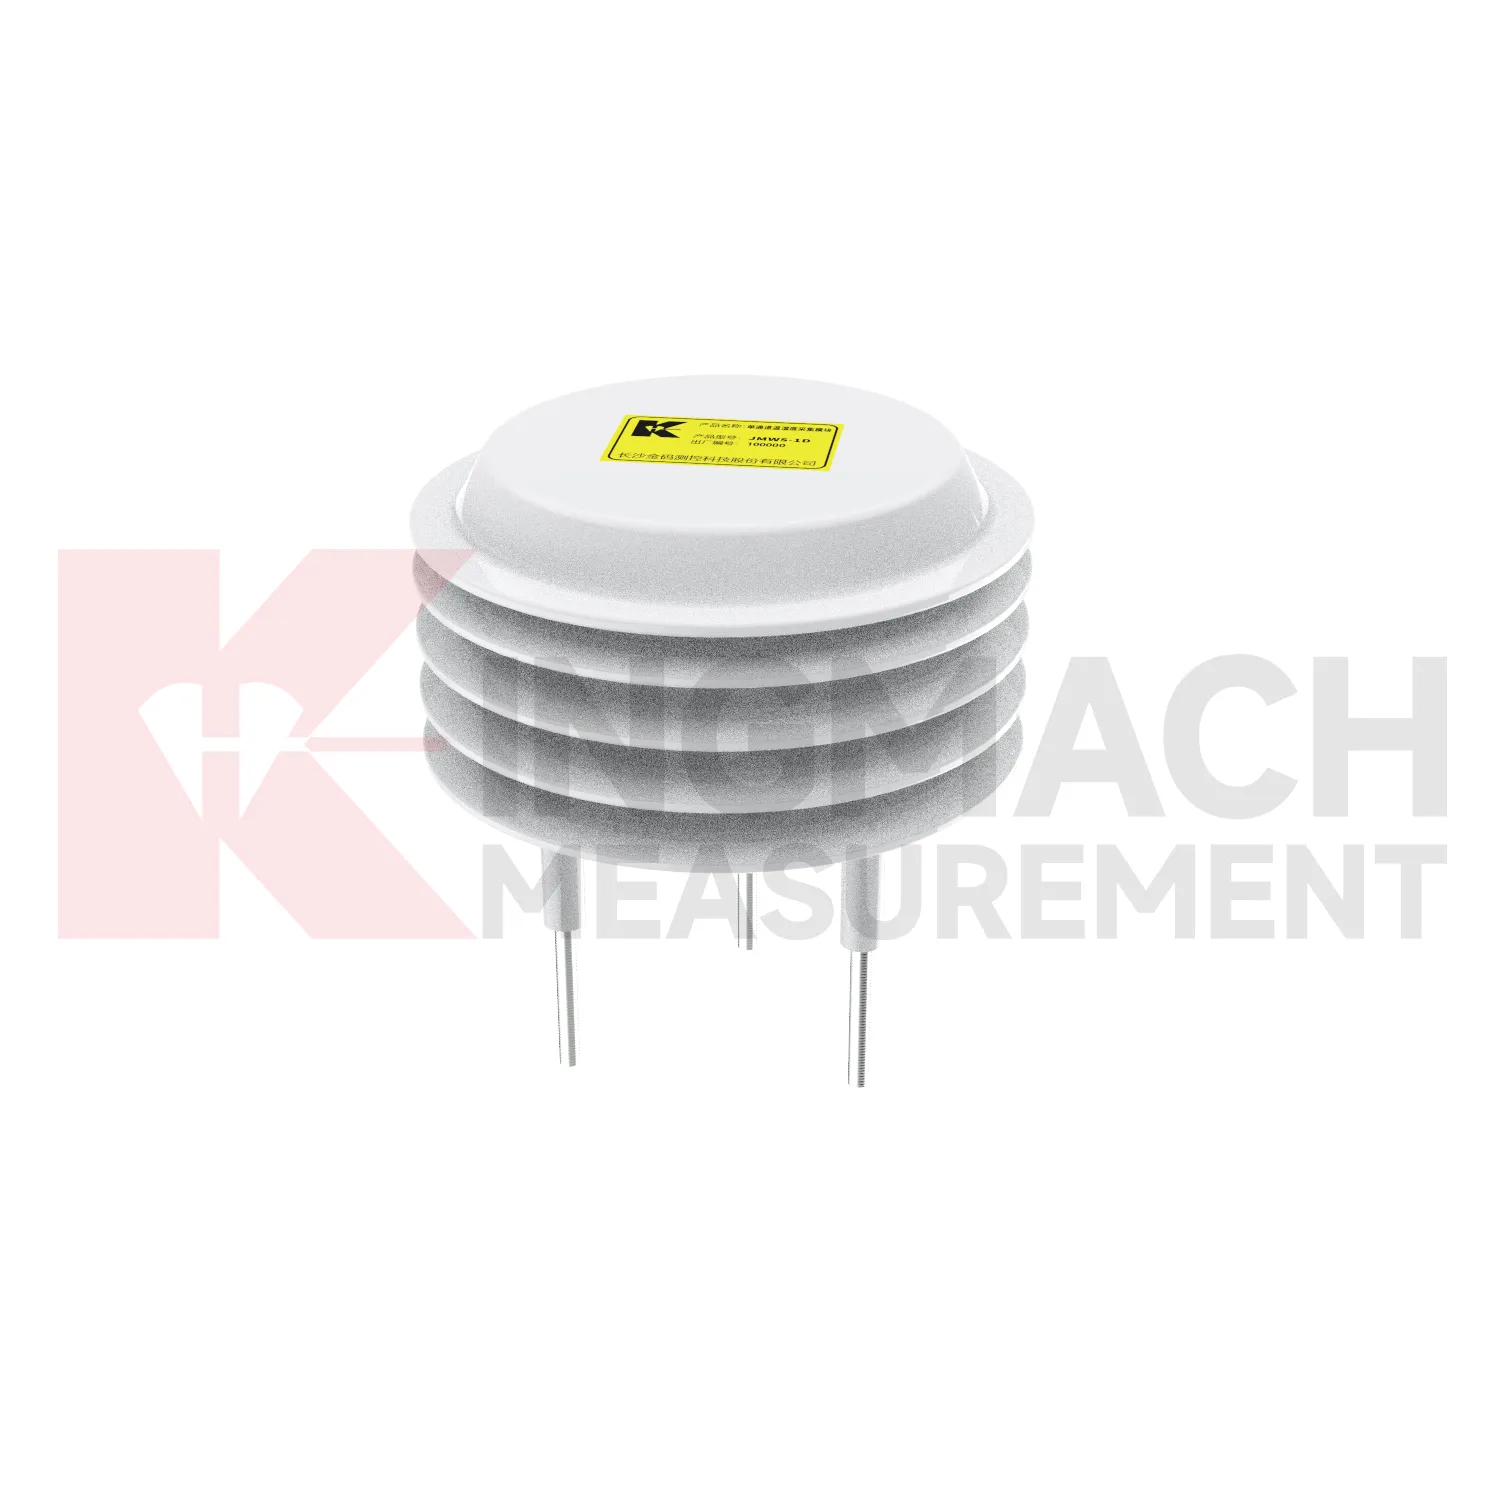
Kingmach Integrated Monitoring Station is most useful when environmental data is treated as context for other measurements. Temperature can explain thermal expansion or sensor drift. Rainfall can explain slope movement, seepage, or delayed settlement. Humidity can affect cabinets, connectors, corrosion, and tunnel equipment rooms. Wind can explain bridge vibration, tower movement, or difficult access conditions. Soil wetness can help interpret embankment behavior and shallow ground response. These conditions do not replace structural instruments; they help those instruments make sense. A good monitoring file shows the environmental trigger, the structural response, the inspection note, and the time relation between them. That combination gives owners a clearer basis for maintenance and field decisions.
The installation file should explain why the location represents the monitored area. If the point is sheltered, shaded, exposed, buried, elevated, or placed inside an enclosure, that fact changes how later readings should be understood by maintenance staff.
During abnormal events, the first question is not only whether the value crossed a limit. The reviewer should ask what changed around the site, whether the related structure reacted, and whether a field inspection confirmed the same pattern.
FAQ
Q: Where should a rain point be placed?
A: It should be level, open to the sky, and away from obstructions, splash sources, roof edges, and debris-prone areas.
Q: Where should wind be measured?
A: Wind should be measured where airflow represents the asset or work area being reviewed, not behind a wall or sheltered obstruction.
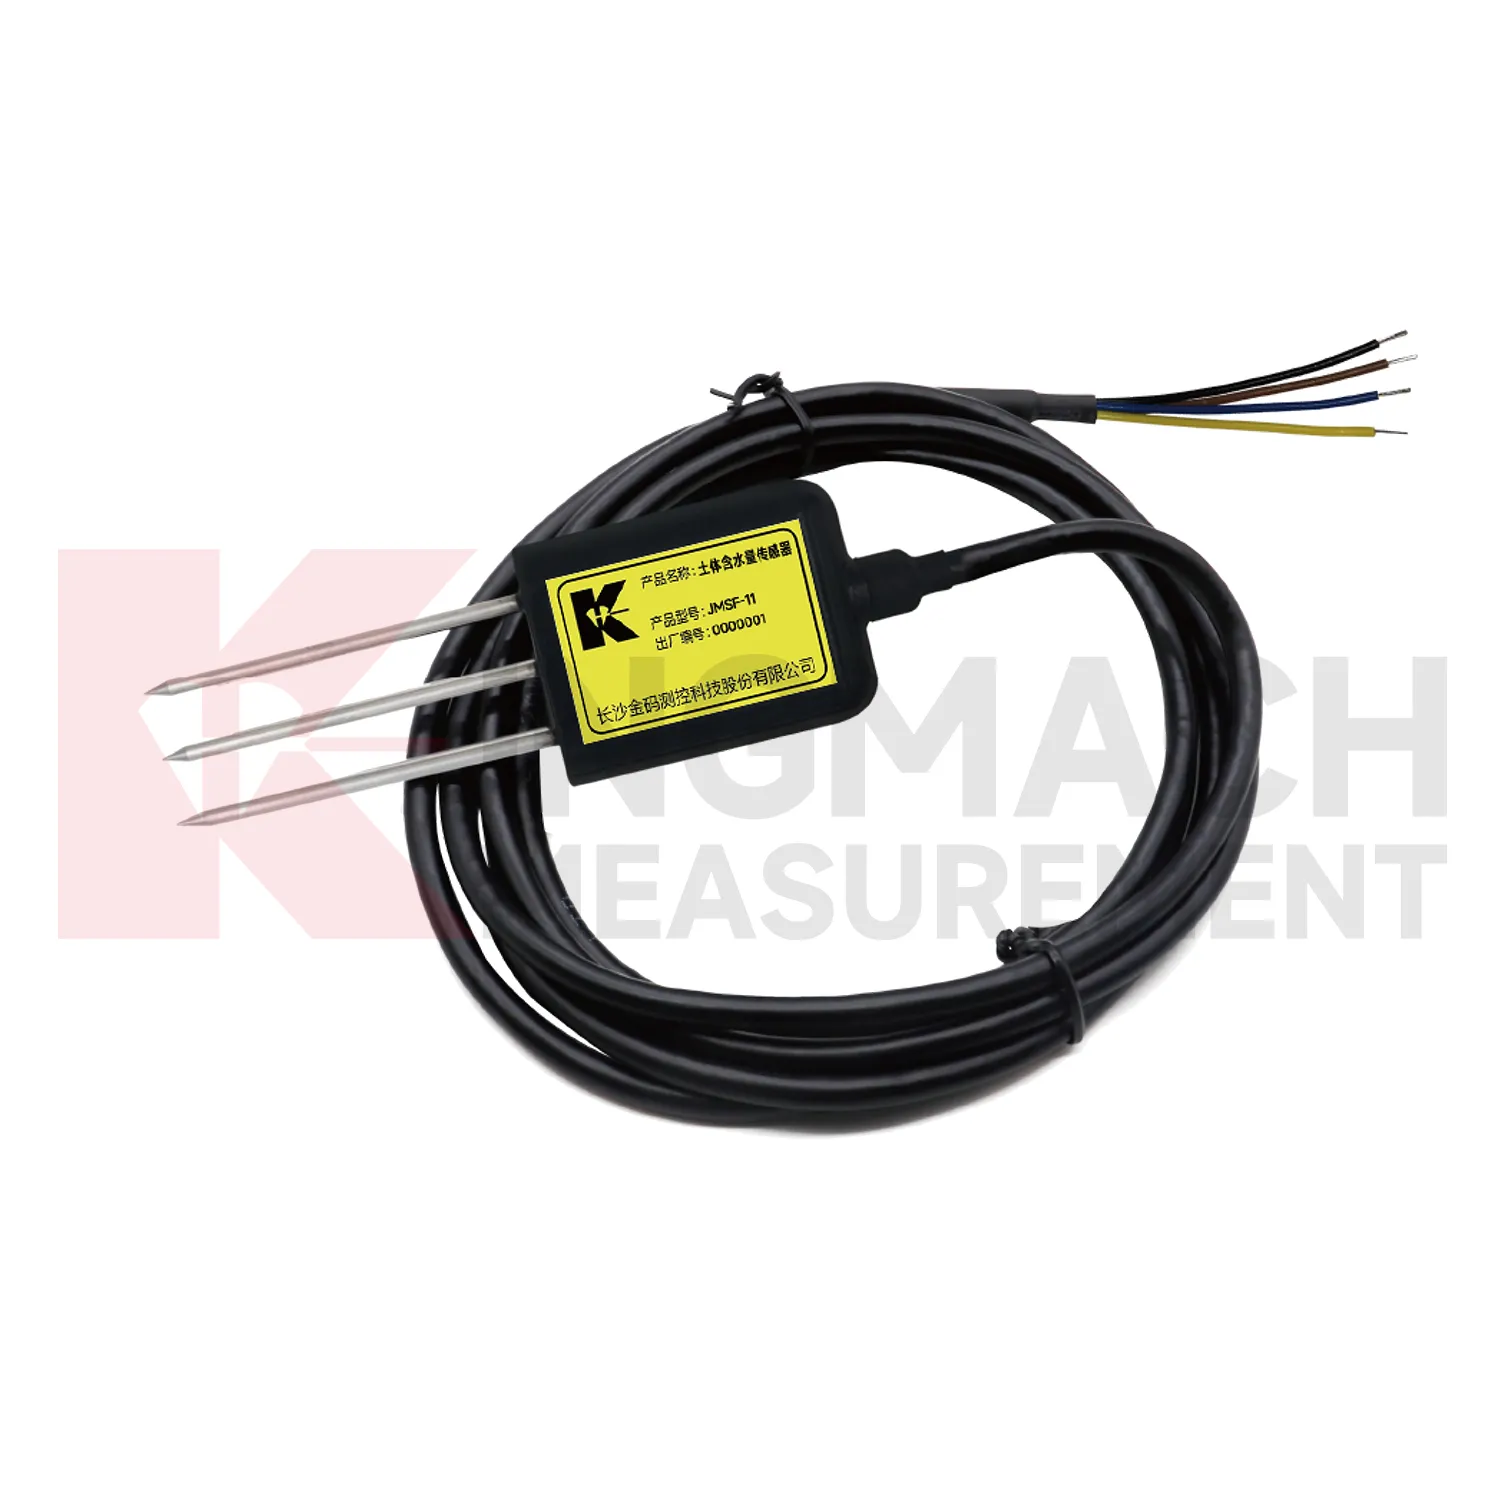
Q: How should soil points be installed?
A: They should have firm contact with the surrounding soil, a recorded depth, protected cable route, and a stable first value.
Q: What should commissioning records include?
A: Include point location, measured condition, unit, mounting photo, cable route, power source, data channel, and linked structural record.
Q: Why are photos useful?
A: Photos help future reviewers understand exposure, mounting, cable routing, and whether later site changes affected readings.
Maintenance teams should record cleaning, access difficulty, enclosure condition, cable repair, vegetation growth, nearby equipment changes, and the first normal reading after work. Those notes protect the meaning of the curve when old data is reviewed months later.
Reviews
Daniel Brown
Excellent environmental monitoring sensors. The data is consistent, and the system integrates smoothly with our existing setup.
Andrew Lee
The visualization software is intuitive and powerful. It helps us analyze monitoring data efficiently.
Latest Inquiries
To protect the privacy of our buyers, only public service email domains like Gmail, Yahoo, and MSN will be displayed. Additionally, only a limited portion of the inquiry content will be shown.
Isabella***@gmail.comGermany
Hello, we are evaluating weir flow meters for a water management project. Please share accuracy deta...
Olivia***@gmail.comUnited States
Hello, we are currently sourcing high-precision strain gauges and load cells for a bridge monitoring...
Related product categories
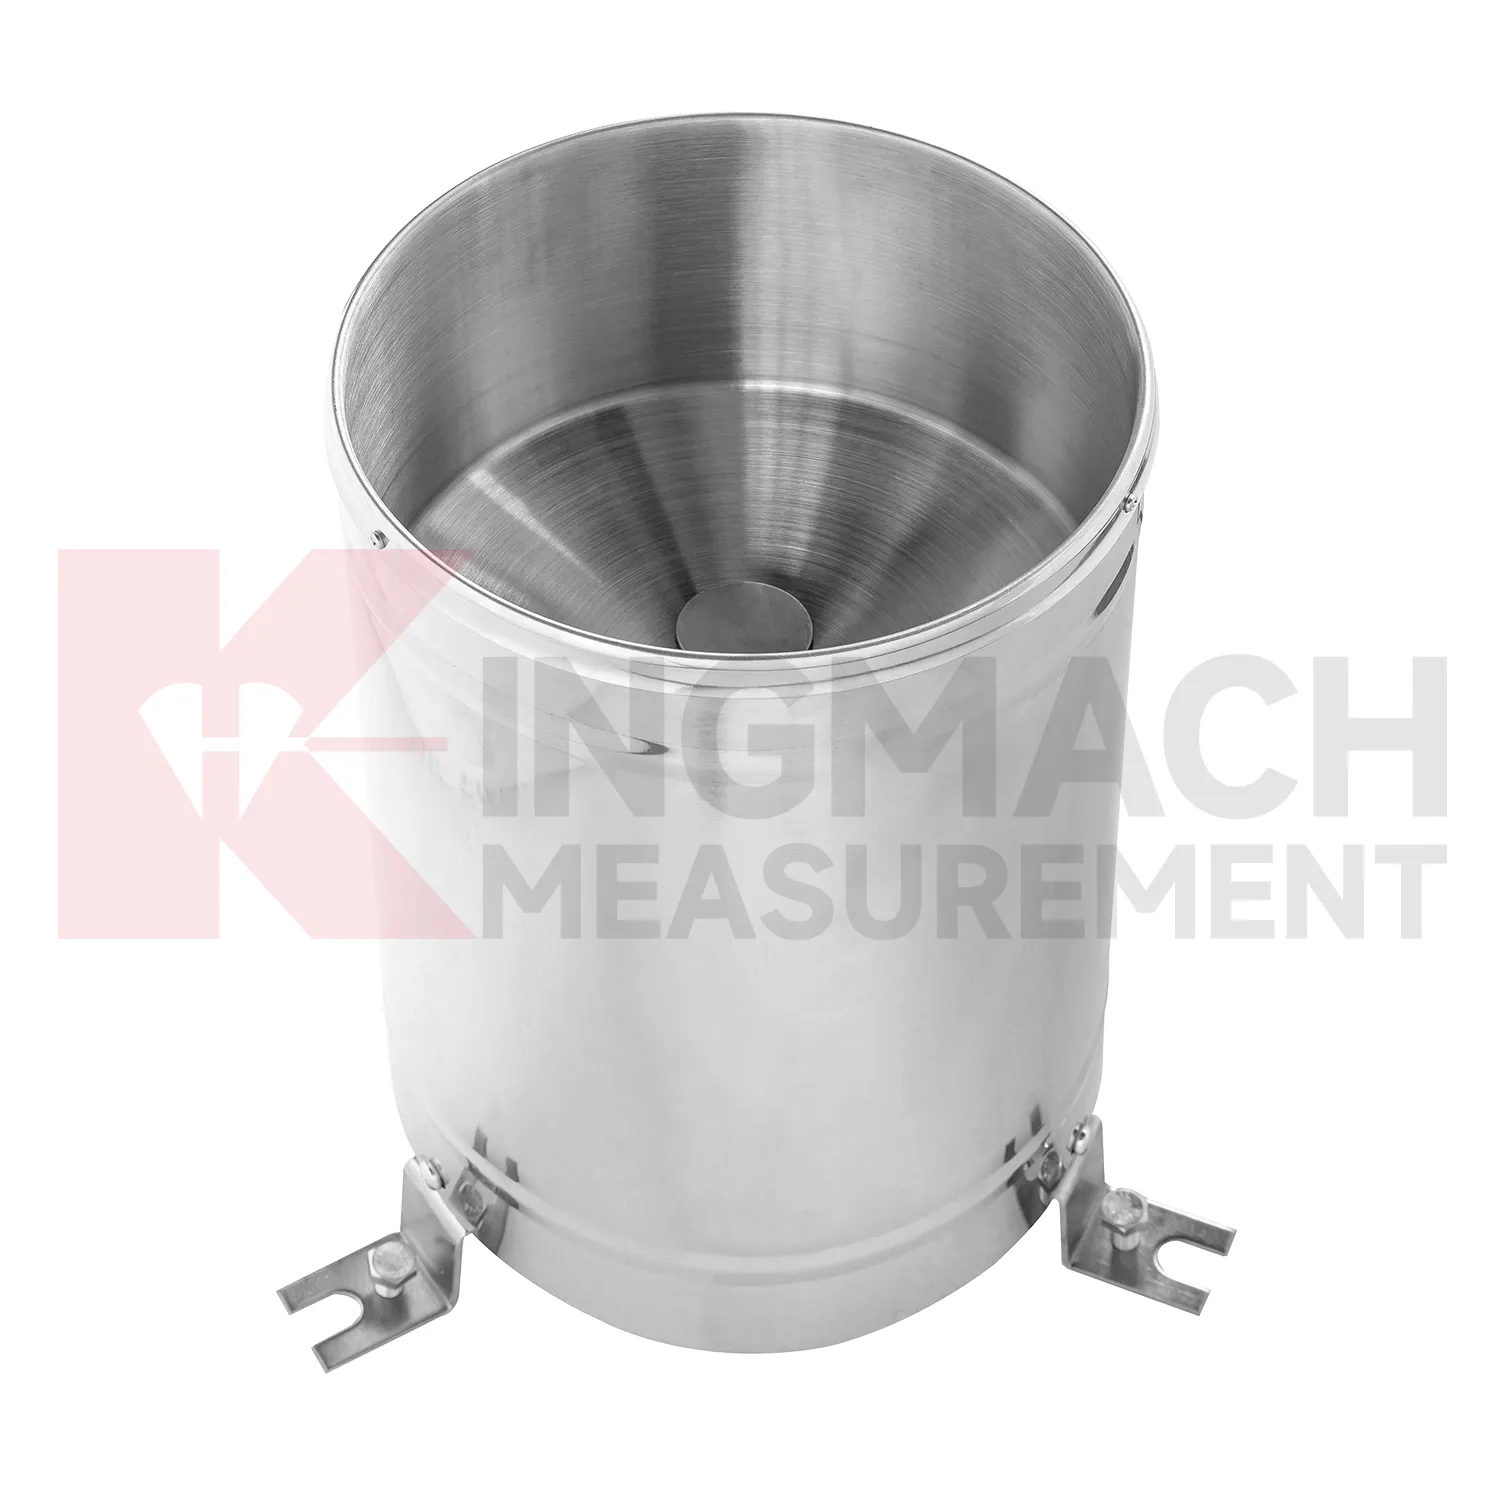
- tipping bucket rain gauge resolution 0.1 mm standard
- rain gauge tipping bucket
- tipping bucket rain gauge sensor
- tipping bucket type rain gauge
- tipping rain bucket gauge
- tipping bucket rain gauge 0.2 mm per tip standard
- tipping bucket rain gauge 0.2 mm resolution standard
- tipping bucket rain gauge data logger
- tipping bucket rain gauge resolution 0.1 mm typical
- tipping bucket rain gauge resolution 0.2 mm typical
- tipping bucket rain gauge typical resolution 0.2 mm standard
- typical tipping bucket rain gauge resolution 0.2 mm standard