 ar
ar bg
bg hr
hr cs
cs da
da nl
nl fi
fi fr
fr de
de el
el hi
hi it
it ko
ko no
no pl
pl pt
pt ro
ro ru
ru es
es sv
sv tl
tl iw
iw id
id lv
lv lt
lt sr
sr sk
sk sl
sl uk
uk vi
vi et
et hu
hu th
th tr
tr fa
fa ms
ms hy
hy ka
ka ur
ur bn
bn mn
mn ta
ta kk
kk uz
uz ku
ku
Soil Water Content Sensor
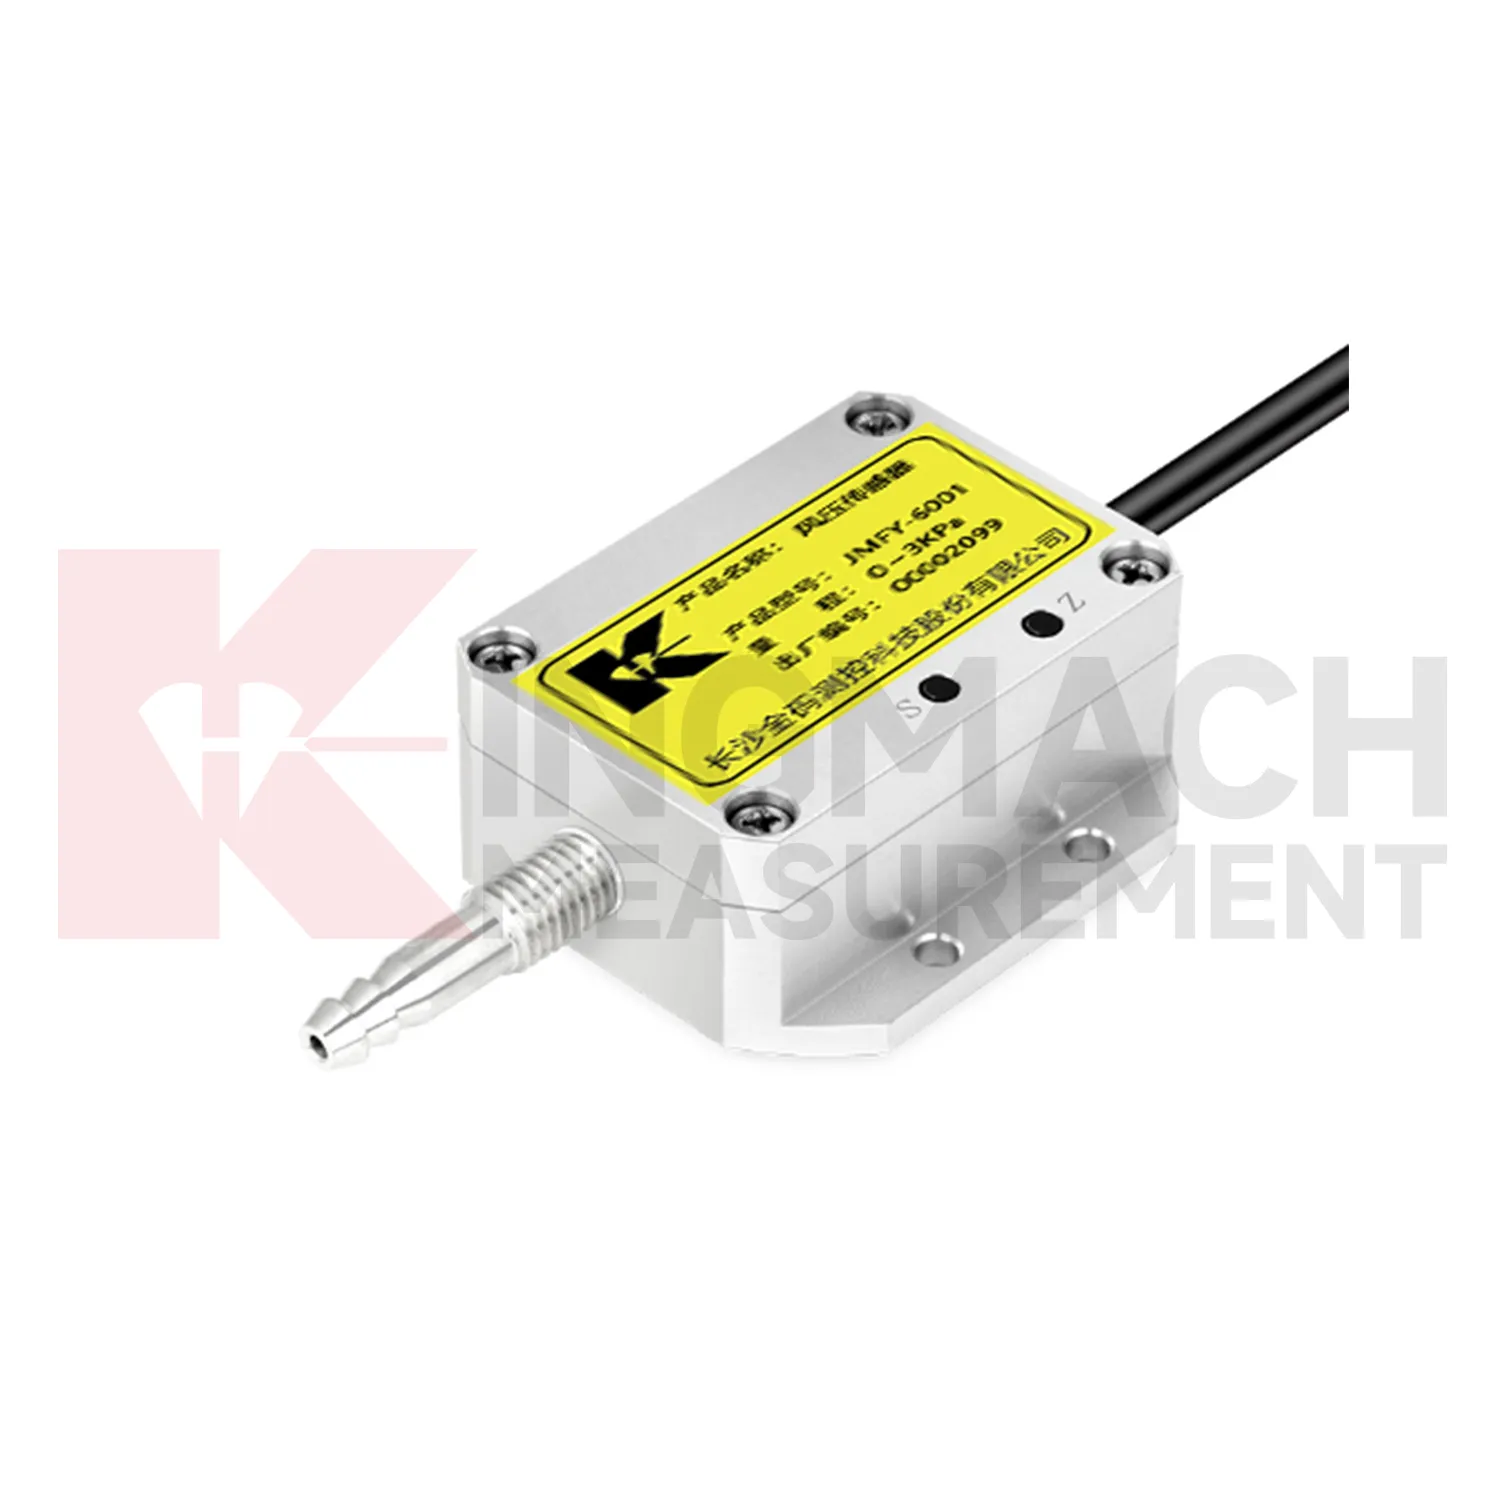
Pressure monitoring in Kingmach Soil Water Content Sensor is useful when the project needs to understand wind load, air movement, gas pressure, or controlled pressure differences around equipment and structures. A pressure point may support bridge response review, ventilation systems, enclosed spaces, dry gas control, or antechamber monitoring. The installation should protect the pressure path from blockage, water, dust, loose tubing, and accidental disconnection. Because pressure data often changes quickly, channel naming and time alignment are important. If pressure is being compared with vibration, wind speed, or structural movement, the records should share a review timeline. A pressure value without context may be hard to judge. A pressure value connected to wind direction, operating condition, and structural response can explain why a vibration, alarm, or access issue occurred.
For owners, the strongest record is the one that remains understandable after staff changes. Clear units, plain point names, installation photos, maintenance notes, and linked structural channels make the data usable beyond the original project team.
For field teams, this point is most useful when the record shows the condition before the structural response, during the response, and after the site returns to routine operation. The note should include weather timing, inspection access, nearby construction, and whether the linked structural points changed in the same period.
Application of Soil Water Content Sensor
Integrated monitoring platforms use Kingmach Soil Water Content Sensor as the condition layer beside structural instruments. A platform should not display environmental values as decoration. Each channel should support a review path: rainfall for slope and seepage behavior, wind for bridge and tower response, temperature for strain and expansion, humidity for cabinet reliability, pressure for airflow or wind load, and soil wetness for ground movement. Setup should define units, time alignment, alarm review, linked structural channels, and maintenance responsibilities. During an abnormal event, the reviewer should be able to compare the condition change with structural response without opening separate files. That is how environmental data becomes useful in daily operation, emergency review, and long-term asset management.
Platform design should group channels by risk rather than by instrument type. A bridge wind group, slope rainfall group, tunnel humidity group, or dam seepage group is easier for field staff to understand than a long list of unrelated values. This grouping also helps alarm review because the relevant condition and response appear together.
Permission and reporting workflows matter too. Designers may need detailed curves, maintenance staff may need station status, and owners may need a plain event summary. A well-organized platform lets each user see the environmental context needed for their decision.
The future of Soil Water Content Sensor
Future Kingmach Soil Water Content Sensor reporting will make abnormal-event review more traceable. A report that says a slope moved after rain should show rainfall timing, wetting response, movement rate, and inspection results together. A report that says bridge vibration rose during wind should show wind direction, wind period, structural response, and related maintenance notes. This reduces manual work and makes reports easier to defend. Environmental records should follow the same naming and time standards as structural records. When the reporting workflow is consistent, owners can compare events across seasons, assets, and maintenance teams.
The next step is report structure that follows the event, not the instrument list. A storm report should gather rain, wetting, seepage, ground movement, photographs, and field actions. A heat-related report should gather temperature, strain behavior, expansion observations, and cabinet status. This makes the document easier for owners, designers, and field crews to review together.
Traceable reporting also protects future decisions. If the same asset produces another alarm years later, the team can compare event type, measured condition, inspection result, and repair action without rebuilding the story from scattered files. That continuity is often more useful than a single high-resolution curve.
Care & Maintenance of Soil Water Content Sensor
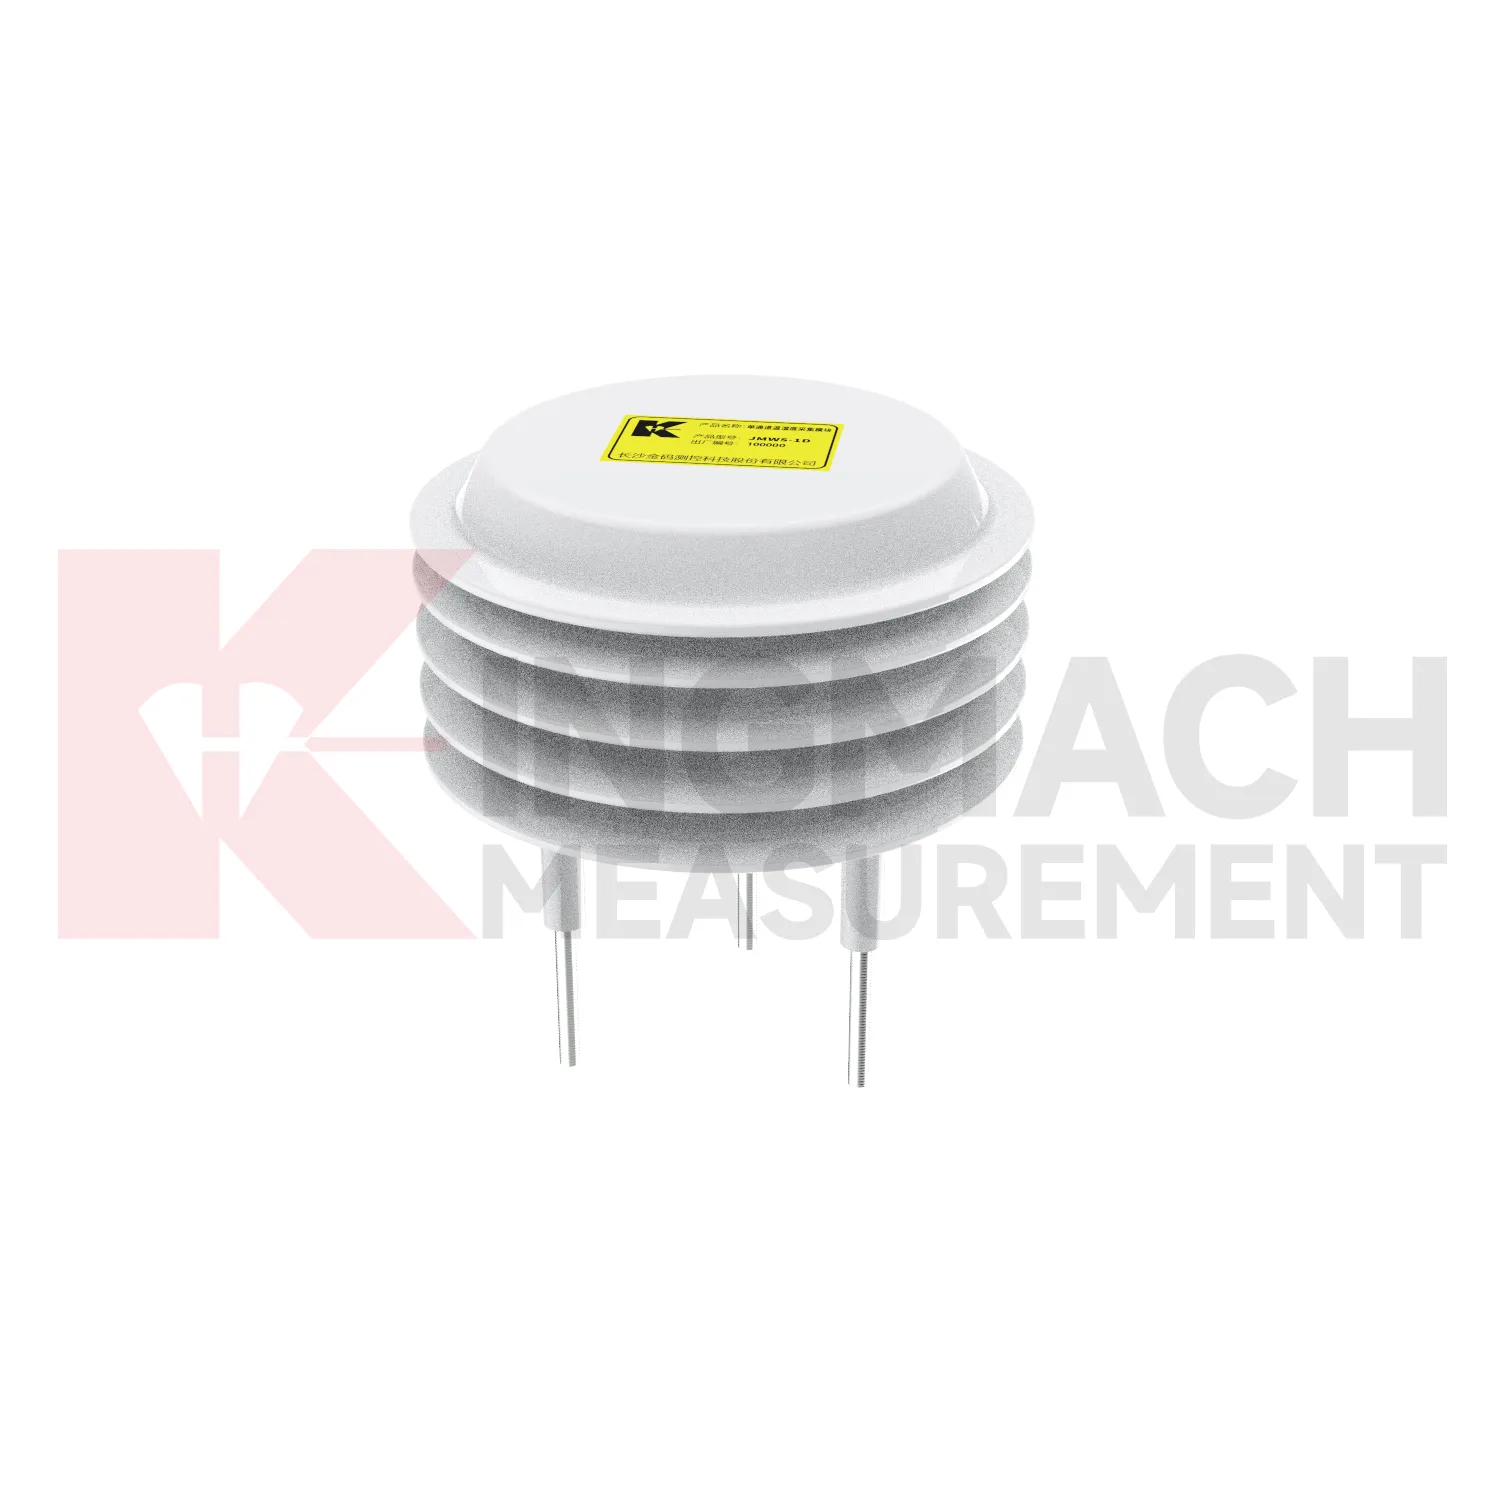
Communication and unit checks are essential for Kingmach Soil Water Content Sensor. Environmental stations may contain rainfall, wind, pressure, humidity, temperature, and soil-condition channels with different units and signal paths. After cabinet work, software changes, or data logger replacement, confirm that each channel still points to the correct location and unit. A swapped channel can turn a useful record into a confusing report. Wiring diagrams, channel tables, scale factors, and point photos should be kept together. During an alarm, the reviewer should not have to guess whether a curve is wind speed, pressure, rainfall, or humidity. Clear communication records make environmental data usable under pressure.
Maintenance teams should record cleaning, access difficulty, enclosure condition, cable repair, vegetation growth, nearby equipment changes, and the first normal reading after work. Those notes protect the meaning of the curve when old data is reviewed months later.
The environmental point should be part of a named monitoring question. It may explain wetting, drying, wind exposure, thermal movement, cabinet stress, or pressure variation, but that purpose needs to be visible in drawings and reports.
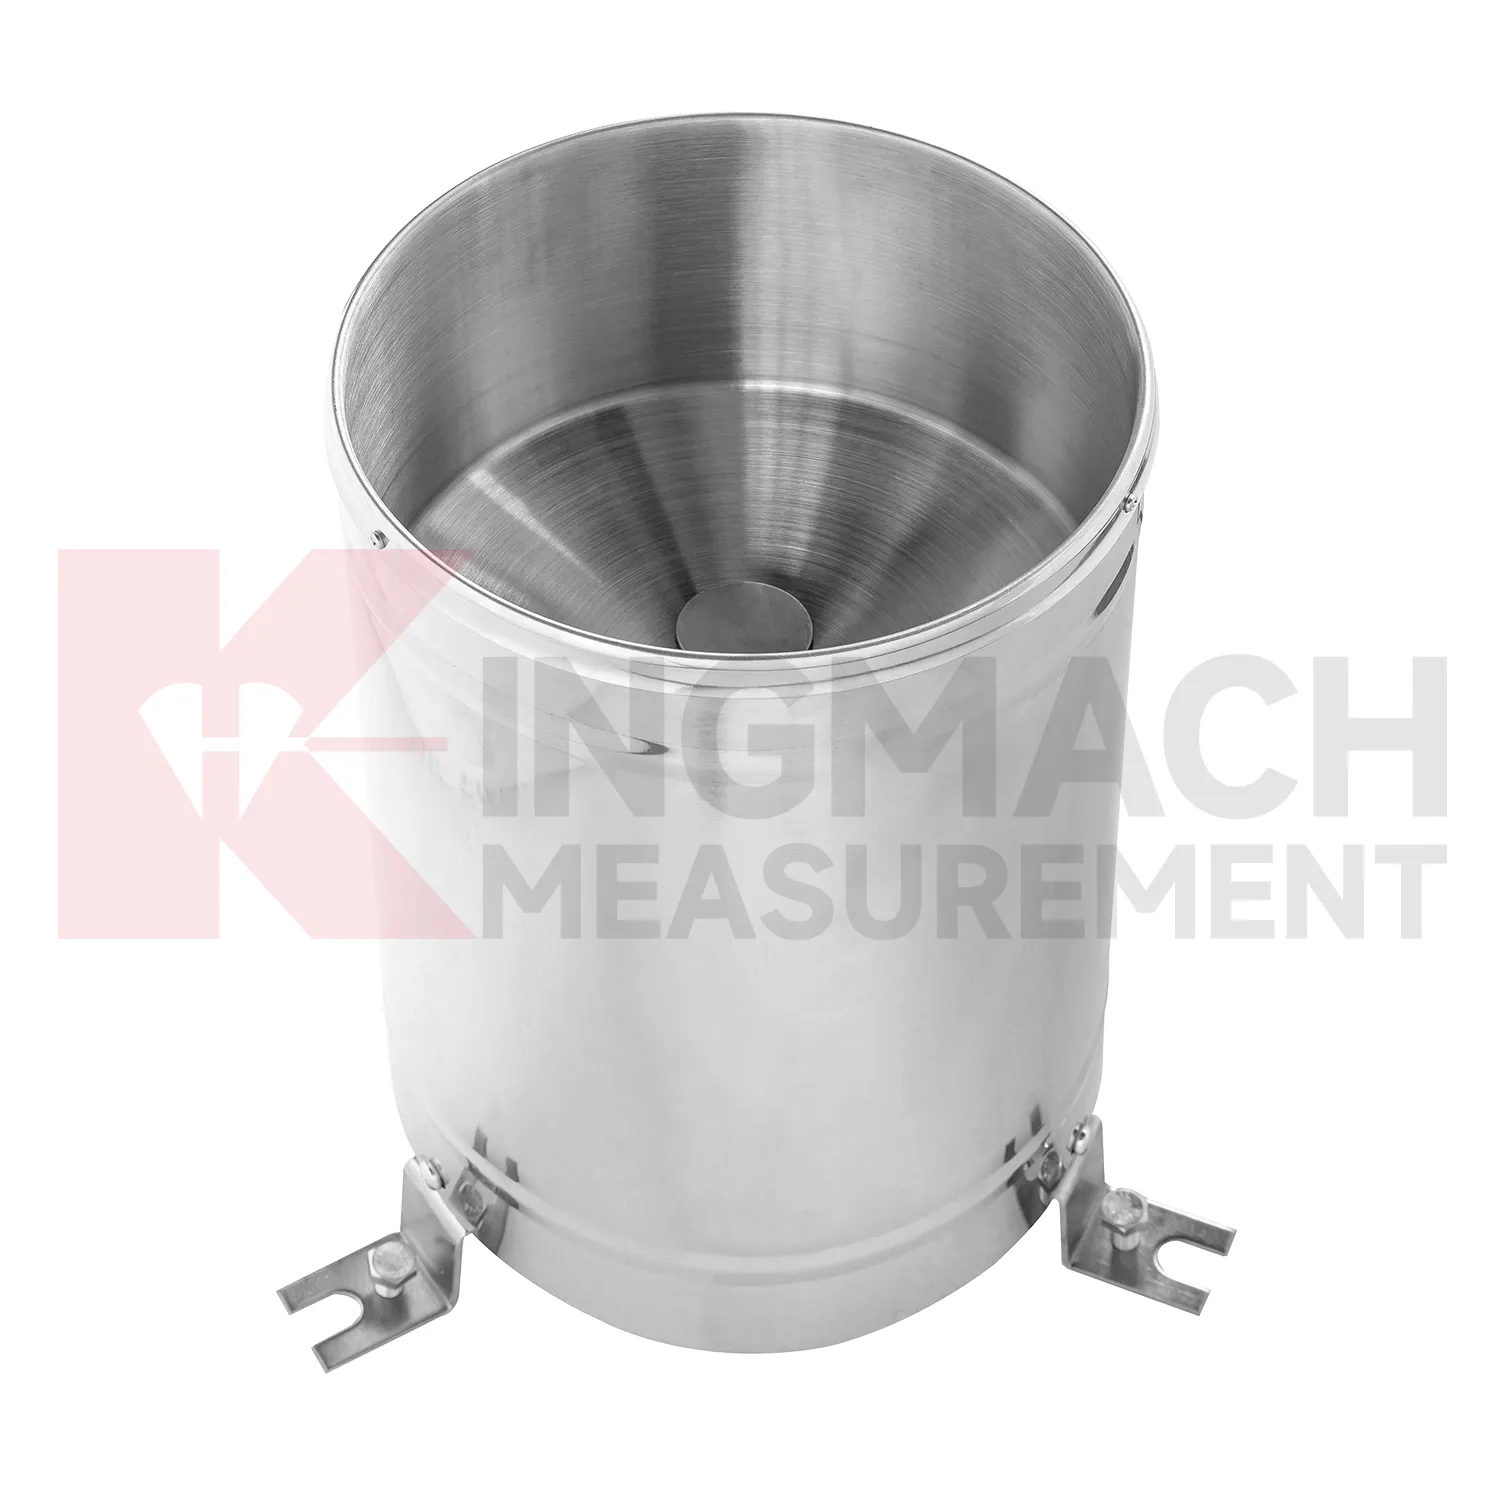
Kingmach Soil Water Content Sensor
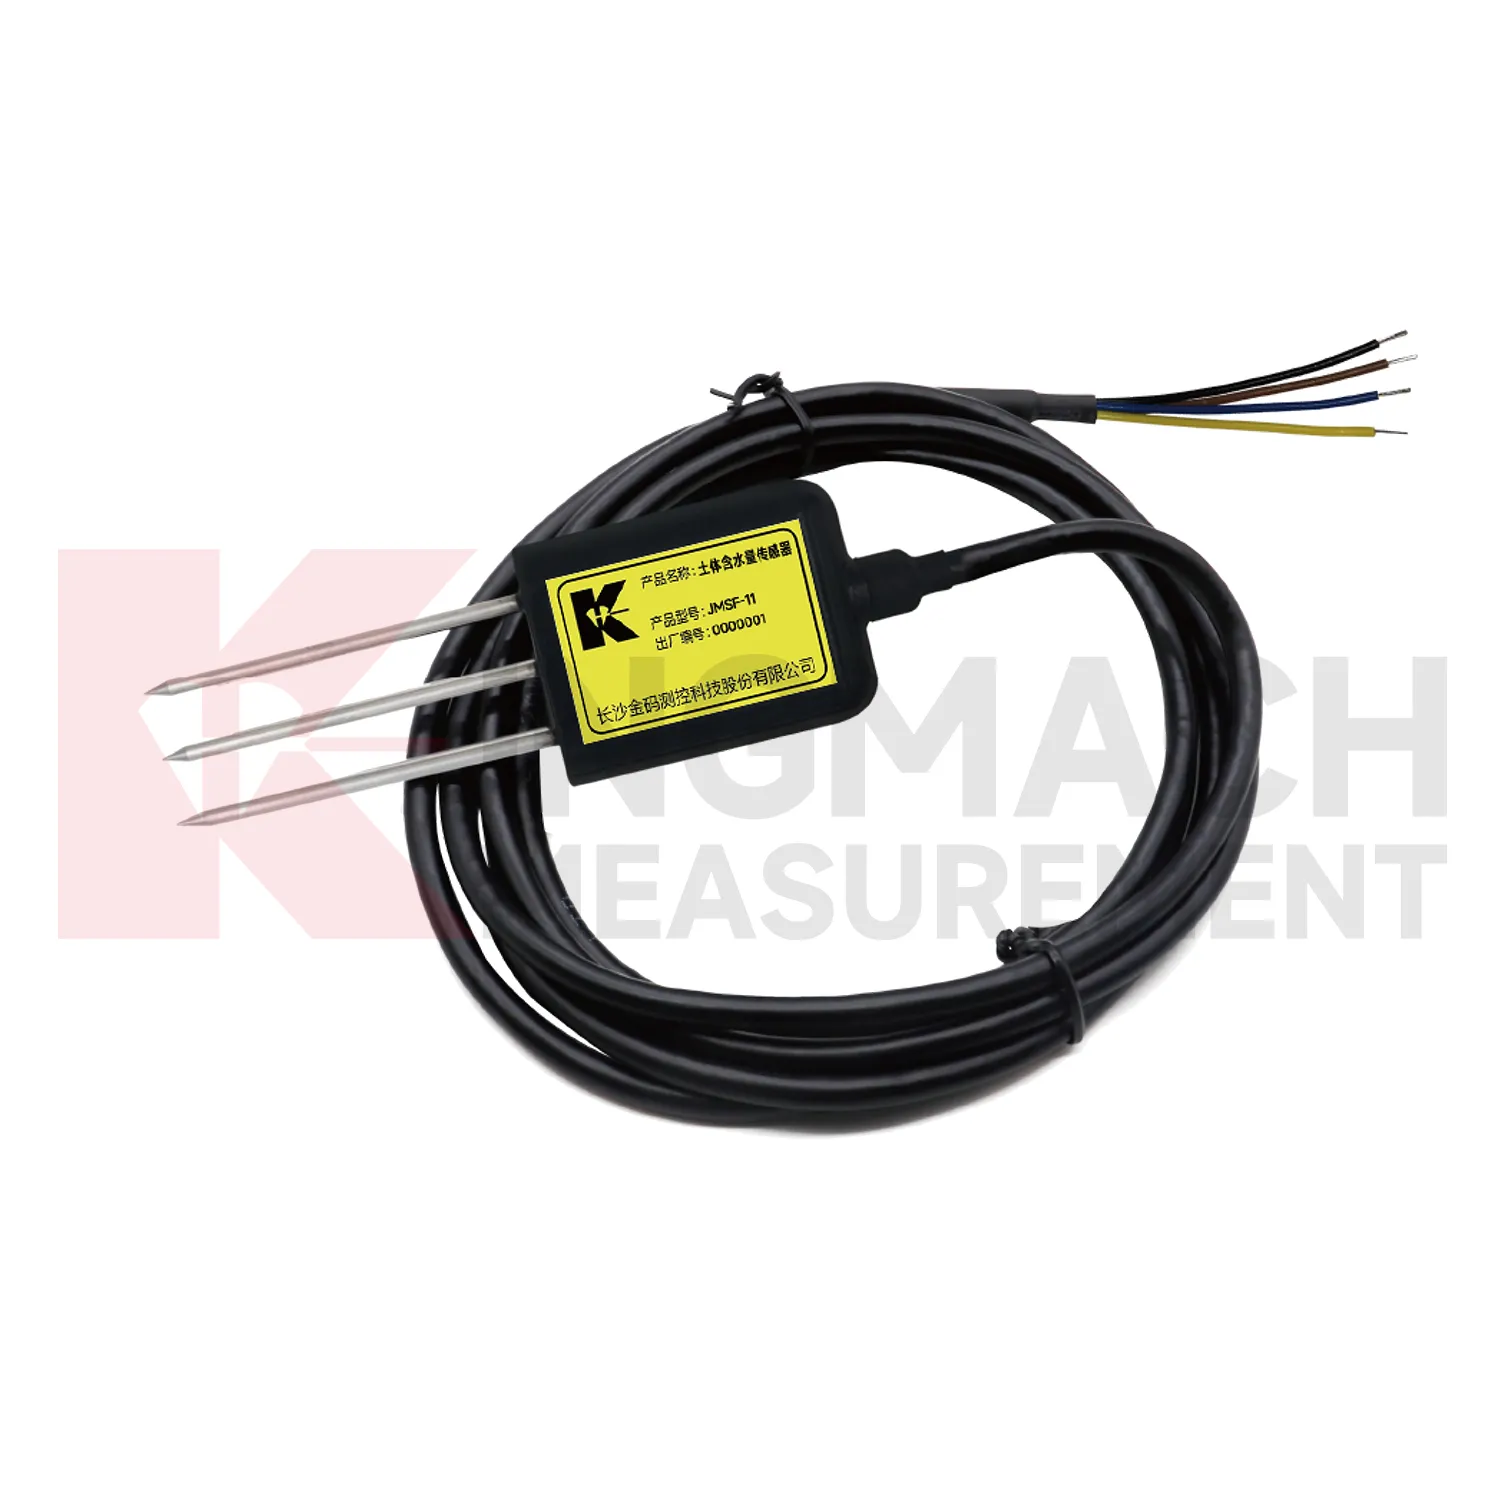
Soil wetness gives Kingmach Soil Water Content Sensor a direct link between weather and ground behavior. Surface rainfall alone does not show whether water reached the depth where deformation is occurring. Buried moisture readings help engineers see wetting, drying, irrigation effect, drainage performance, and seasonal change inside the soil body. This is important for slopes, embankments, greenhouses, agricultural projects, hydraulic works, and reclamation areas. A soil record should be tied to depth, soil type, cable route, and nearby deformation points. When wetness rises before displacement accelerates, the relation deserves attention. When soil dries while movement remains active, another cause may be involved. The value is in comparing conditions, not in displaying an isolated moisture number.
A practical report links the condition value with time, place, and action. It should help a reviewer decide whether to keep observing, inspect the field point, compare nearby instruments, or record the event as normal site behavior.
For owners, the strongest record is the one that remains understandable after staff changes. Clear units, plain point names, installation photos, maintenance notes, and linked structural channels make the data usable beyond the original project team.
FAQ
Q: Where should a rain point be placed?
A: It should be level, open to the sky, and away from obstructions, splash sources, roof edges, and debris-prone areas.
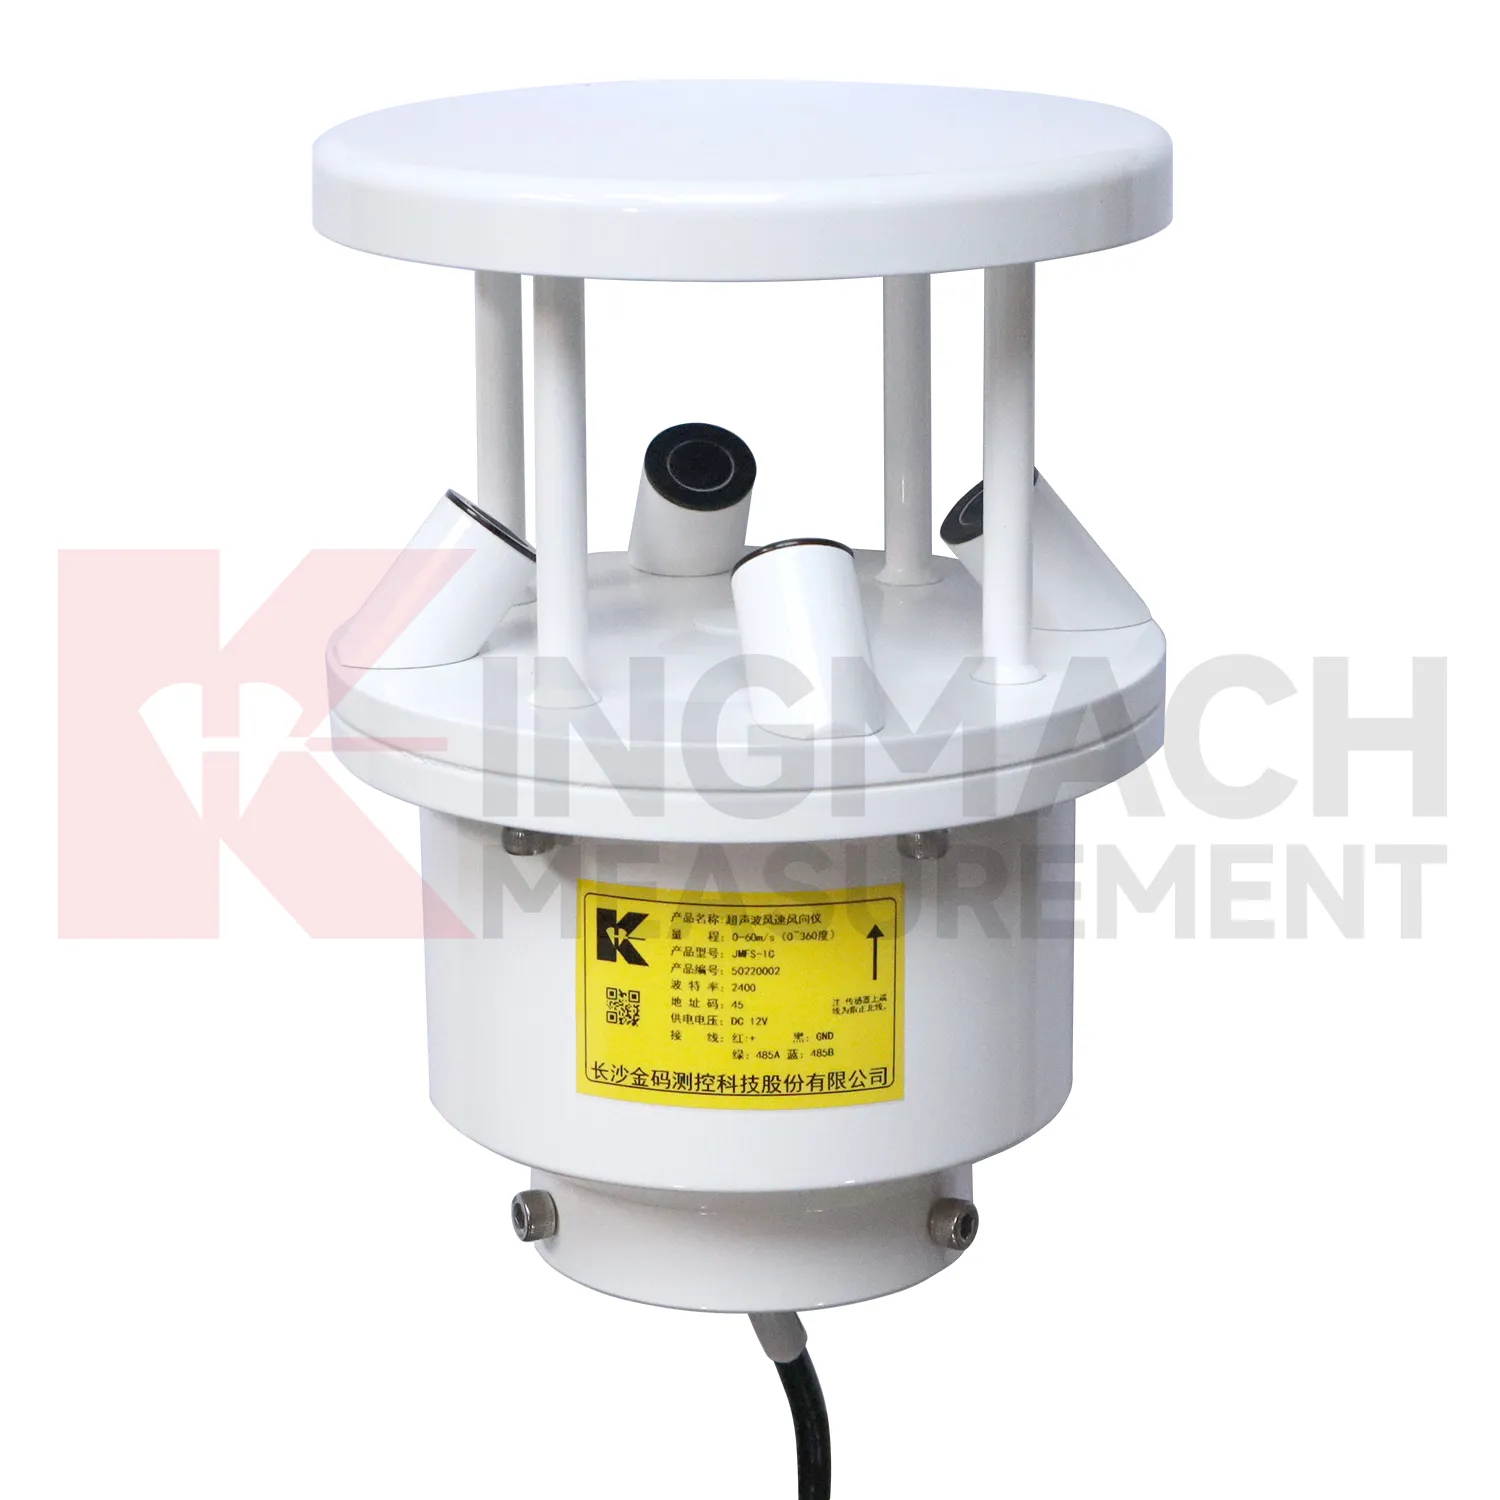
Q: Where should wind be measured?
A: Wind should be measured where airflow represents the asset or work area being reviewed, not behind a wall or sheltered obstruction.
Q: How should soil points be installed?
A: They should have firm contact with the surrounding soil, a recorded depth, protected cable route, and a stable first value.
Q: What should commissioning records include?
A: Include point location, measured condition, unit, mounting photo, cable route, power source, data channel, and linked structural record.
Q: Why are photos useful?
A: Photos help future reviewers understand exposure, mounting, cable routing, and whether later site changes affected readings.
Maintenance teams should record cleaning, access difficulty, enclosure condition, cable repair, vegetation growth, nearby equipment changes, and the first normal reading after work. Those notes protect the meaning of the curve when old data is reviewed months later.
Reviews
Joshua Clark
We ordered a full monitoring solution including sensors and data loggers. Everything works seamlessly together. Great supplier!
Andrew Lee
The visualization software is intuitive and powerful. It helps us analyze monitoring data efficiently.
Latest Inquiries
To protect the privacy of our buyers, only public service email domains like Gmail, Yahoo, and MSN will be displayed. Additionally, only a limited portion of the inquiry content will be shown.
Sophia***@gmail.comUnited Kingdom
Good day, we need environmental monitoring sensors including temperature, humidity, and wind sensors...
Harper***@gmail.comIndia
Dear Sir, we are planning to procure a complete monitoring system including strain gauges, tiltmeter...
Related product categories
- Integrated Monitoring Station
- Soil Water Content Sensor
- Ultrasonic Anemometer
- semiconductor temperature sensor
- semiconductor based temperature sensors
- semiconductor temperature sensors
- semiconductor based temperature sensor
- semiconductor based ic temperature sensor
- semiconductor-based temperature sensors
- resistance temperature detector sensor
- resistive temperature sensor
- resistance temperature sensor