 ar
ar bg
bg hr
hr cs
cs da
da nl
nl fi
fi fr
fr de
de el
el hi
hi it
it ko
ko no
no pl
pl pt
pt ro
ro ru
ru es
es sv
sv tl
tl iw
iw id
id lv
lv lt
lt sr
sr sk
sk sl
sl uk
uk vi
vi et
et hu
hu th
th tr
tr fa
fa ms
ms hy
hy ka
ka ur
ur bn
bn mn
mn ta
ta kk
kk uz
uz ku
ku
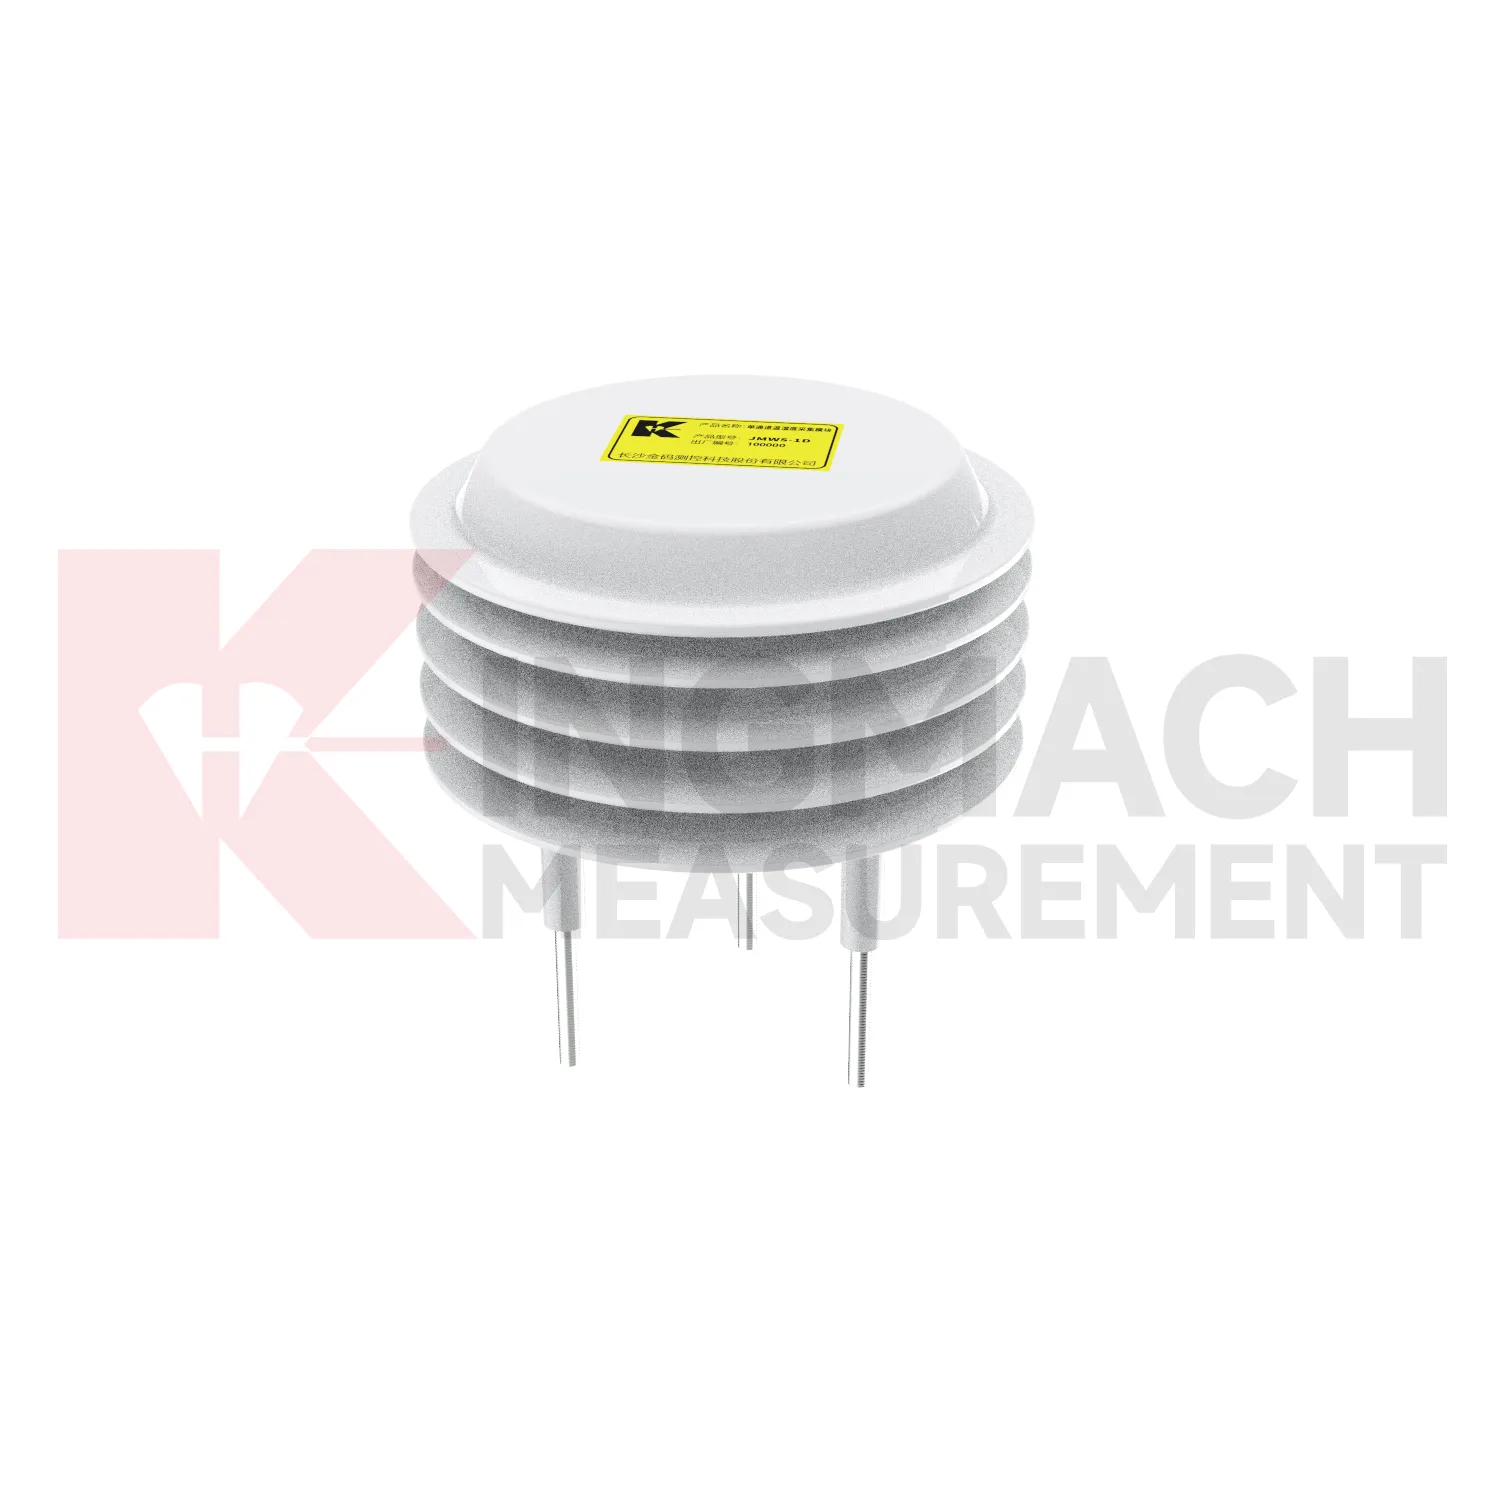
resistance temperature sensors
Data acquisition for Kingmach resistance temperature sensors should be organized around units, time, and relationships. Environmental channels may report rainfall, wind, pressure, temperature, humidity, or soil wetness, and each needs a clear unit and location. A mixed station becomes confusing if channel names are vague or if the data logger does not preserve the relation between environmental points and structural points. The project file should define which environmental channel supports which engineering review. Rainfall may connect to slope movement. Wind may connect to vibration. Temperature may connect to strain. Humidity may connect to cabinet maintenance. A simple channel map can save a great deal of time during an alarm. Good acquisition practice makes environmental data reliable enough to use when the site is under stress.
Long-term value comes from consistency. A channel that keeps the same location, unit, maintenance history, and linked asset record can support seasonal comparison, post-storm review, and handover between construction and operation teams.
Maintenance teams should record cleaning, access difficulty, enclosure condition, cable repair, vegetation growth, nearby equipment changes, and the first normal reading after work. Those notes protect the meaning of the curve when old data is reviewed months later.
The environmental point should be part of a named monitoring question. It may explain wetting, drying, wind exposure, thermal movement, cabinet stress, or pressure variation, but that purpose needs to be visible in drawings and reports.

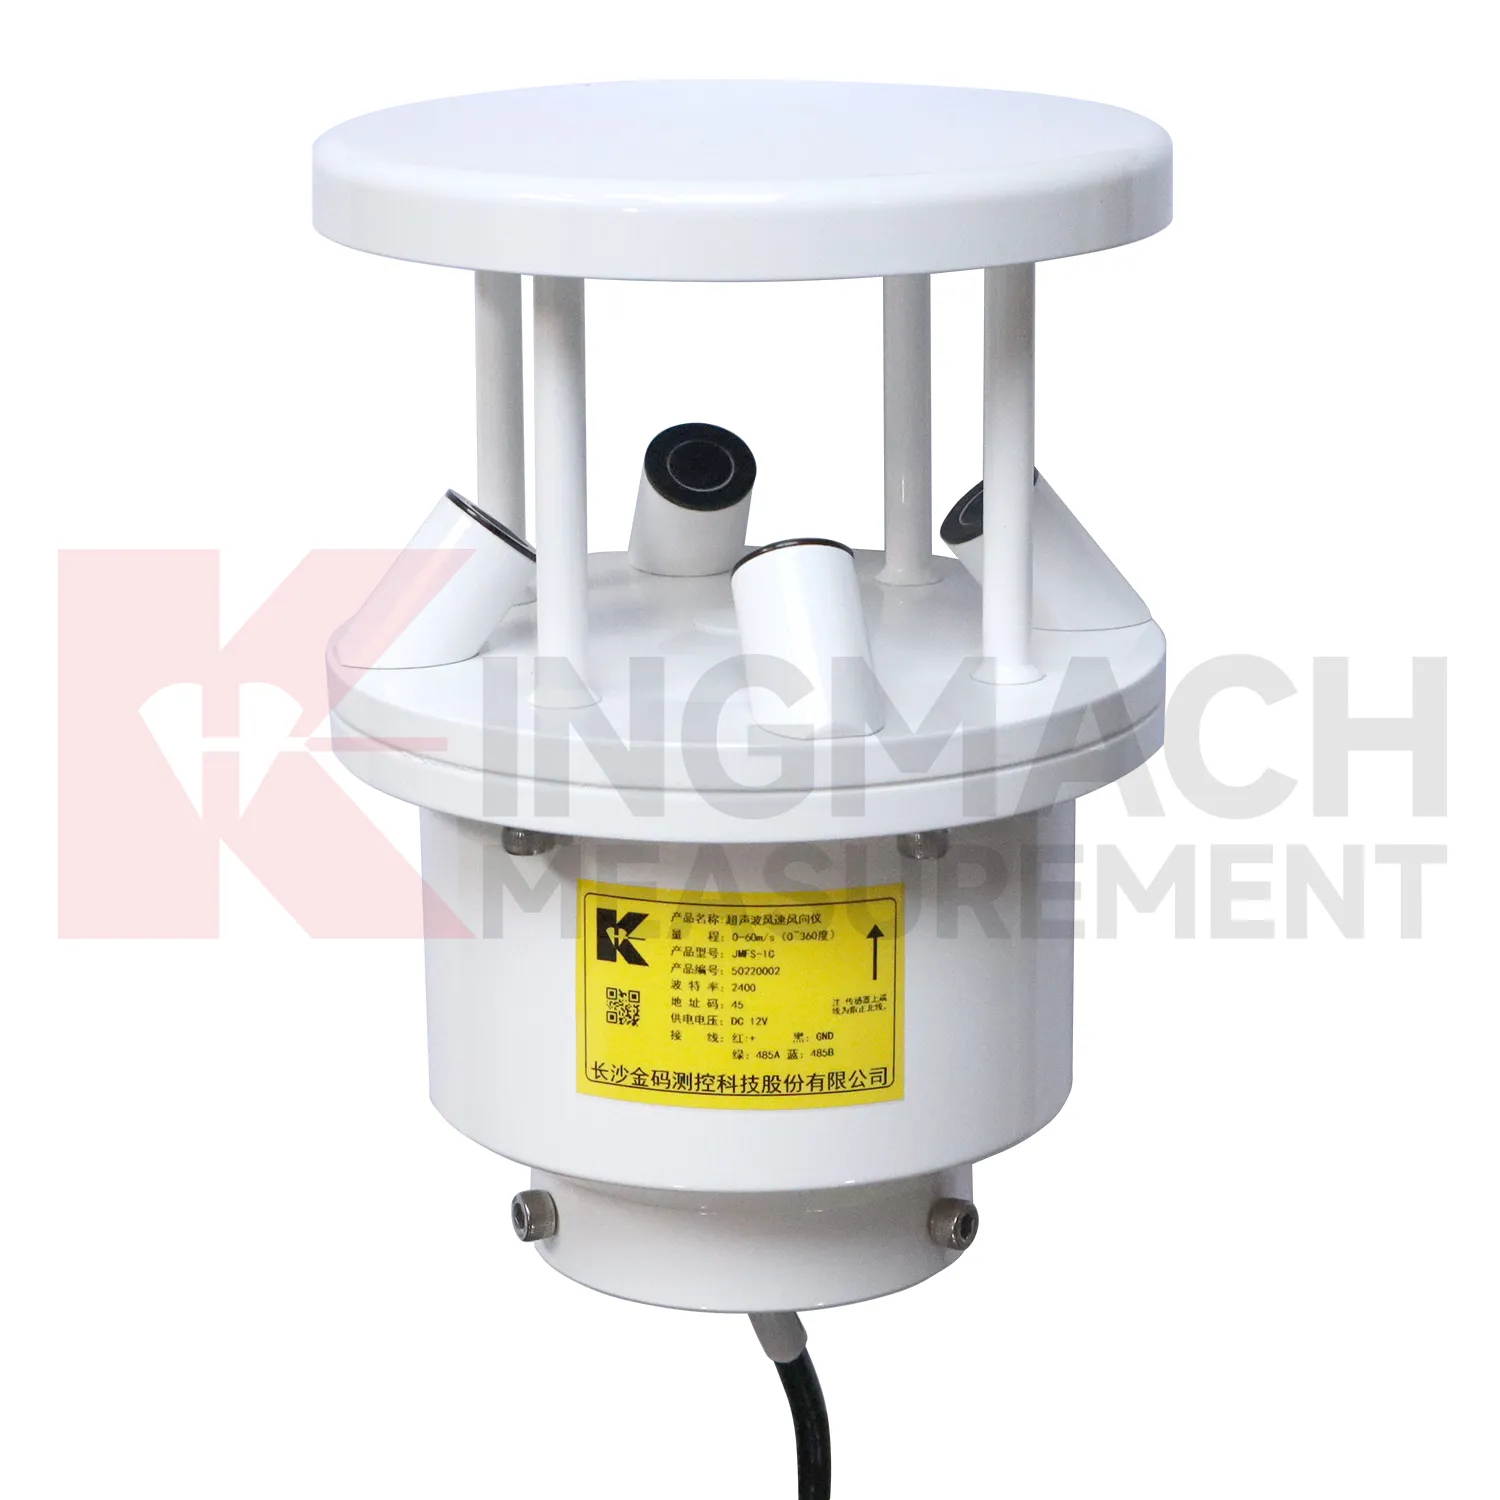
Application of resistance temperature sensors
Construction sites use Kingmach resistance temperature sensors to document conditions that affect work, monitoring data, and later dispute review. Rain can change excavation safety, slope behavior, access roads, concrete work, and water management. Wind can affect lifting, temporary structures, and exposed frames. Temperature and humidity can affect curing, equipment rooms, and sensor cabinets. Environmental data should be collected where it represents the active work zone and should be reviewed beside displacement, settlement, vibration, crack, and inspection records. If a movement change occurs after a storm or heavy wind event, the environmental timeline helps engineers explain the timing. It also gives contractors and owners a shared record instead of relying on memory or informal weather notes.
A practical report links the condition value with time, place, and action. It should help a reviewer decide whether to keep observing, inspect the field point, compare nearby instruments, or record the event as normal site behavior.
For owners, the strongest record is the one that remains understandable after staff changes. Clear units, plain point names, installation photos, maintenance notes, and linked structural channels make the data usable beyond the original project team.
For field teams, this point is most useful when the record shows the condition before the structural response, during the response, and after the site returns to routine operation. The note should include weather timing, inspection access, nearby construction, and whether the linked structural points changed in the same period.
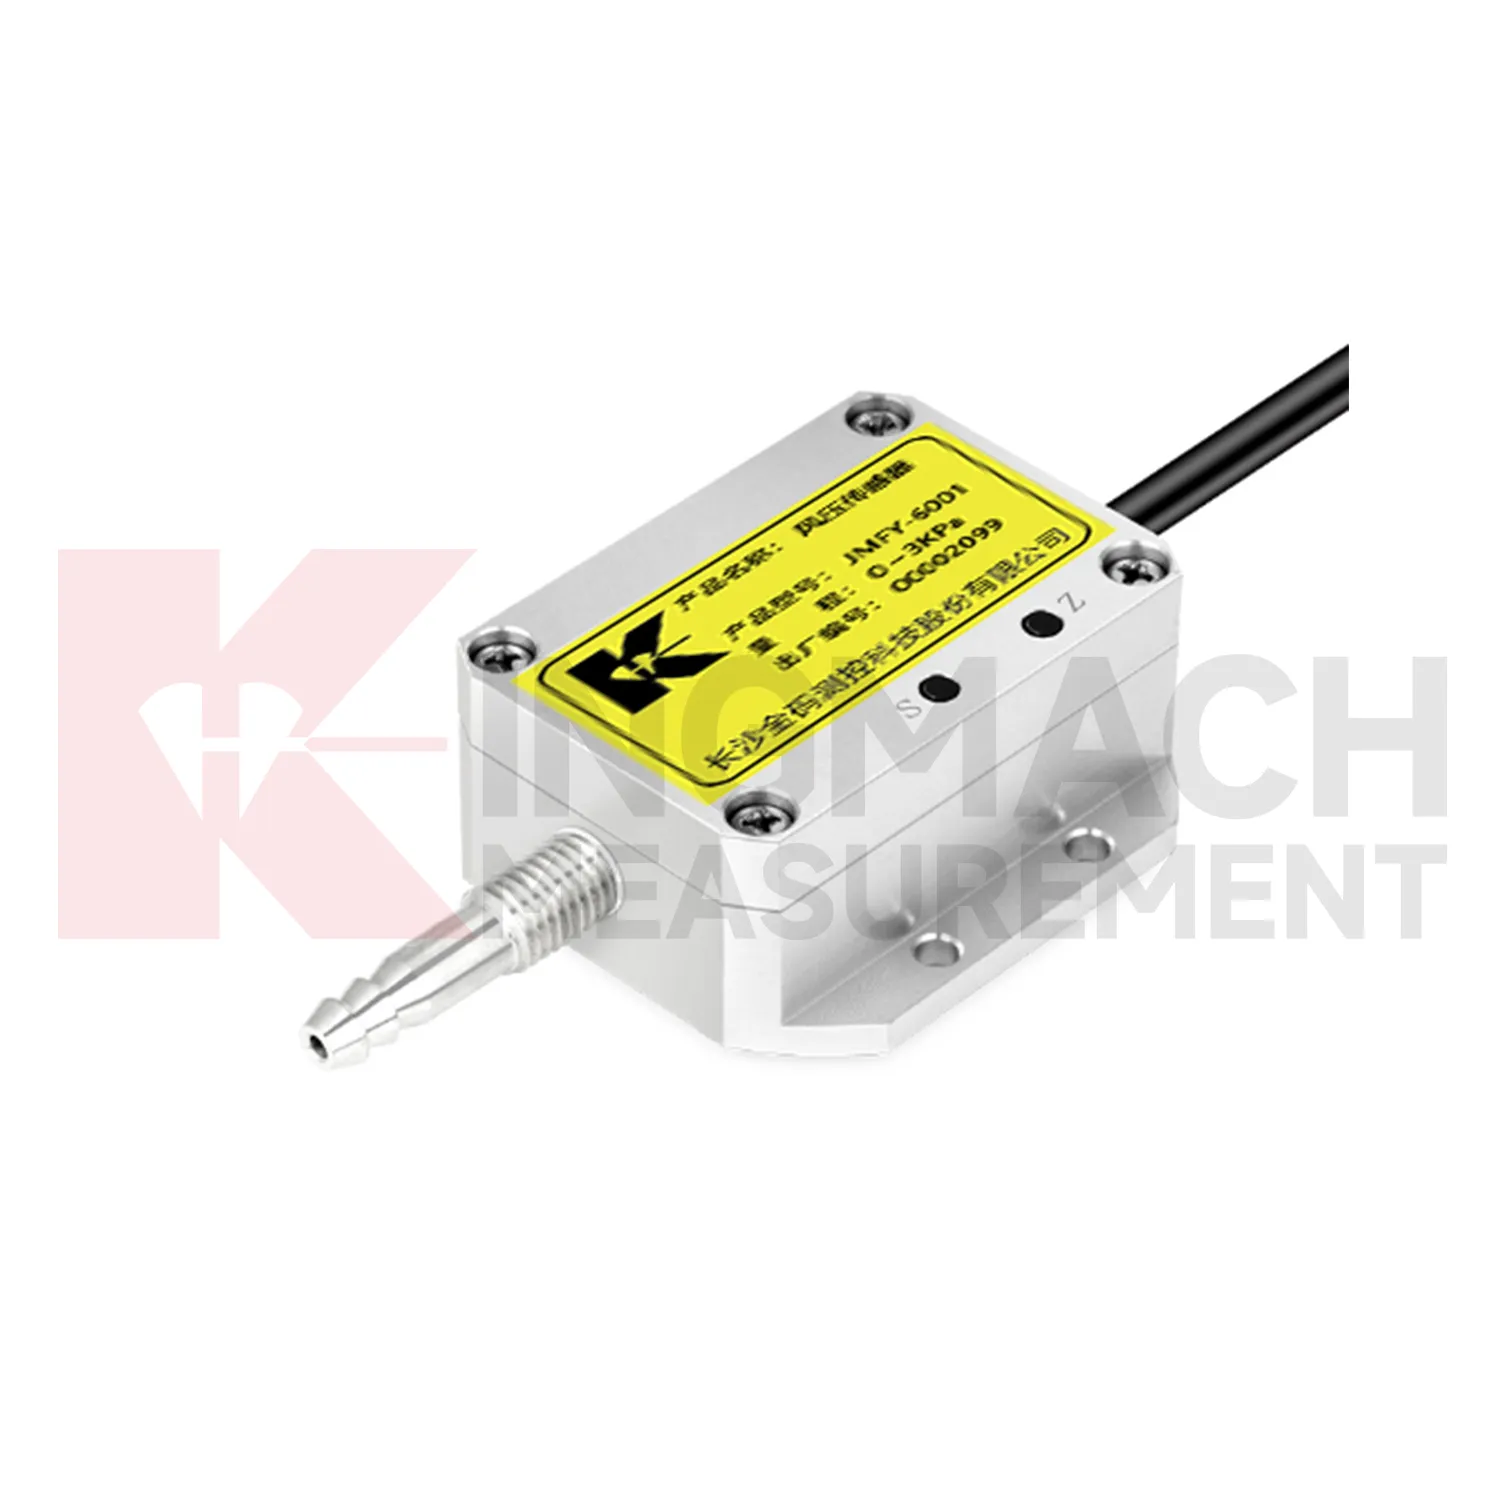
The future of resistance temperature sensors
Compatibility will remain a future requirement for Kingmach resistance temperature sensors. Environmental stations often combine different signal paths, power needs, units, enclosures, cables, and data logger settings. If these details are not planned, installation becomes slow and later replacement becomes confusing. Future specifications should define data output, unit conversion, channel capacity, sampling plan, power source, protection needs, maintenance access, and platform display before installation begins. Clear compatibility keeps environmental data usable through commissioning, operation, repair, and handover. It also prevents a monitoring station from becoming dependent on undocumented field improvisation.
Future compatibility work should also cover spare parts and replacement paths. If a station must be repaired after years of service, the owner should know which signal type, unit conversion, connector style, enclosure space, and platform channel are required before field crews arrive.
This planning reduces downtime during storms, construction stages, and maintenance windows. It also helps teams replace one component without changing the meaning of the environmental record or breaking the link to structural channels.
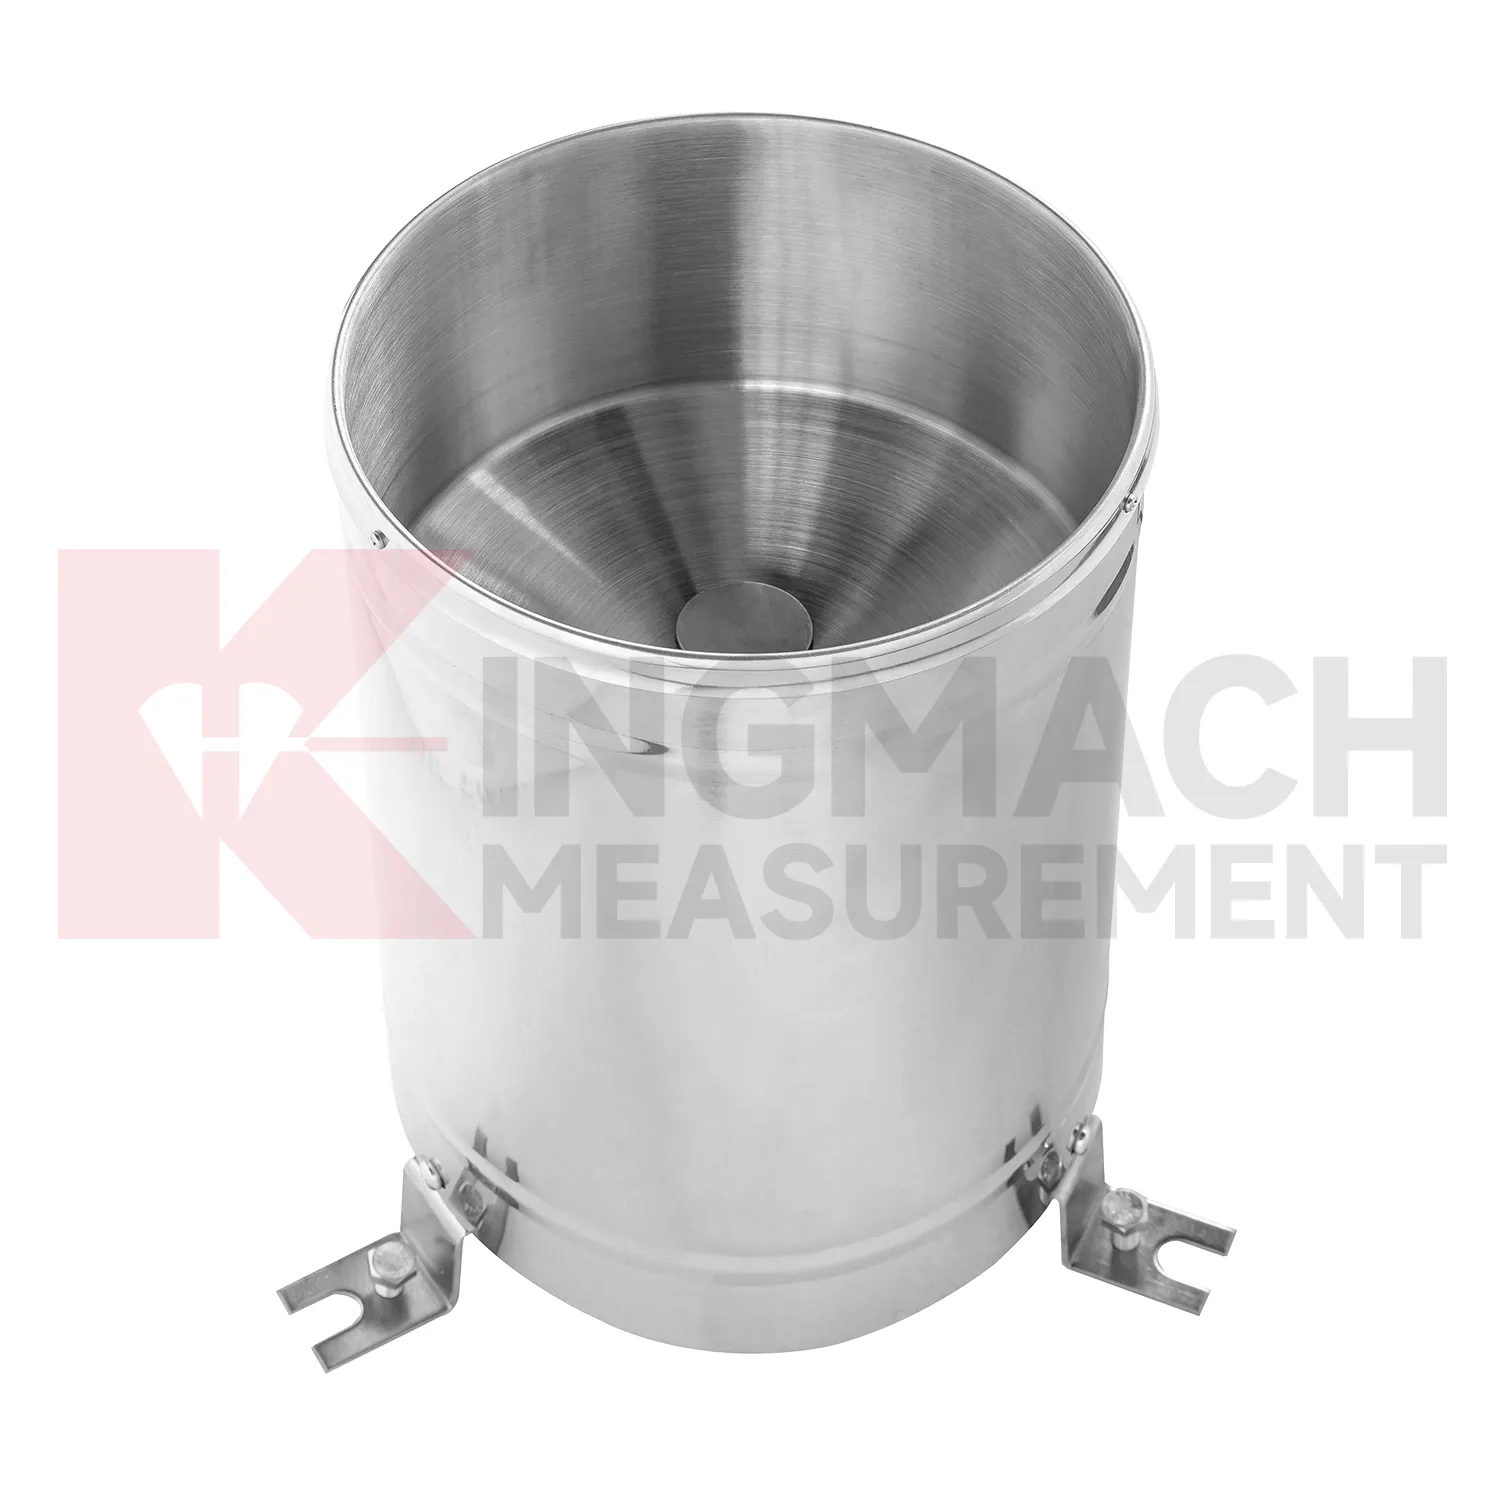
Care & Maintenance of resistance temperature sensors
Rainfall maintenance for Kingmach resistance temperature sensors should focus on keeping the catchment path clean and level. Leaves, dust, insects, scale, bird droppings, splash, and tilted mounting can distort rainfall records. The rain point should be inspected after storms, long dry periods, nearby earthwork, and seasonal debris build-up. Cleaning should be logged with date, condition, leveling status, and the first normal reading after work. Rainfall data is often used to explain slope movement, seepage, tunnel leakage, construction delay, or drainage performance. If the rain record is wrong, the engineering interpretation may also be wrong. Simple field care protects a much larger monitoring decision.
Maintenance teams should record cleaning, access difficulty, enclosure condition, cable repair, vegetation growth, nearby equipment changes, and the first normal reading after work. Those notes protect the meaning of the curve when old data is reviewed months later.
The environmental point should be part of a named monitoring question. It may explain wetting, drying, wind exposure, thermal movement, cabinet stress, or pressure variation, but that purpose needs to be visible in drawings and reports.
Kingmach resistance temperature sensors
Kingmach resistance temperature sensors helps engineering teams read the conditions around a structure before they judge the structure itself. Temperature, humidity, rainfall, wind, pressure, and soil wetness can all change how bridges, tunnels, slopes, buildings, dams, and construction sites behave. A deformation curve after a storm is different from the same curve during a dry week. A strain record during a heat wave needs a temperature background. A cabinet fault in a tunnel may have more to do with moisture than with the instrument connected to it. The purpose of this category is to make those surrounding conditions visible. When environmental records sit beside settlement, displacement, tilt, load, vibration, and inspection notes, engineers can explain why a reading changed instead of only seeing that it changed.
For field teams, this point is most useful when the record shows the condition before the structural response, during the response, and after the site returns to routine operation. The note should include weather timing, inspection access, nearby construction, and whether the linked structural points changed in the same period.
FAQ
Q: Can environmental data support asset management?
A: Yes. Long-term records help owners compare weather, exposure, maintenance events, and structural response across seasons and assets.
Q: How does it help during alarms?
A: It lets reviewers check whether a structural alarm followed rain, wind, temperature change, humidity rise, or another site condition.
Q: What should dashboards show?
A: Dashboards should link environmental channels to the structural risks they explain, rather than displaying unrelated values together.
Q: Why avoid product-list writing?
A: Readers need to understand monitoring purpose and field value; long product lists make the page harder to use and less natural.
Q: What is the best review habit?
A: Review environmental data with time-aligned structural readings, inspection notes, maintenance records, and the site event that triggered concern.
If the reading seems unusual, the team should check the physical condition of the station before drawing conclusions about the asset. Blockage, poor exposure, loose wiring, water entry, and changed surroundings can all create misleading patterns.
Reviews
Andrew Lee
The visualization software is intuitive and powerful. It helps us analyze monitoring data efficiently.
Robert Taylor
The weir flow meter is well-built and delivers accurate measurements. Great value for water management applications.
Latest Inquiries
To protect the privacy of our buyers, only public service email domains like Gmail, Yahoo, and MSN will be displayed. Additionally, only a limited portion of the inquiry content will be shown.
Sophia***@gmail.comUnited Kingdom
Good day, we need environmental monitoring sensors including temperature, humidity, and wind sensors...
Mia***@gmail.comNetherlands
Dear team, we are interested in your readouts & data loggers compatible with multiple sensors. Do yo...
Related product categories
- semiconductor based temperature sensor
- semiconductor based ic temperature sensor
- semiconductor-based temperature sensors
- resistance temperature detector sensor
- resistive temperature sensor
- resistance temperature sensor
- platinum resistance temperature sensor
- resistive temperature sensors
- resistance type temperature sensors
- resistance temperature sensors
- temperature sensor resistance
- ambient temperature sensor resistance